Body Mass Index and Brainstem Raphe Nucleus Echogenicity in de novo Parkinson’s Disease
Article information

Abstract
Background
Weight loss is common in Parkinson’s disease (PD) and there may be many related factors, especially depression and cognitive decline. The application of transcranial sonography (TCS) with respect to the mesencephalic midline may be useful for detecting depression, a risk factor for the development of PD. This study aimed to investigate the association of body mass index (BMI), depression, and cognitive decline using TCS findings of the brainstem raphe (BR).
Methods
We collected data of patients with de novo PD who were aged ≥40 years between January 2015 and January 2018. The patients’ demographic characterisitcs, symptom progression, and motor disabilities were documented at baseline.
Results
A total of 165 patients met the inclusion criteria and were enrolled in this study. Patients with abnormal BR echogenicity showed significantly higher Hamilton depression rating scale (HAM-D) score and lower BMI than patients with normal echogenicity, suggesting that abnormal BR echogenicity was associated with depression and lower body weight. Although there was no significant relationship between BMI and HAM-D score, a trend toward higher HAM-D scores was observed for low BMI patients (r=-0.116, p=0.082). BR-echogenicity-adjusted scatterplots of the relationship between HAM-D score and BMI showed that the HAM-D score was inversely related to BMI in de novo PD patients (r=-0.217, p=0.026).
Conclusion
The findings of this study suggest that depression is related to weight loss in PD patients and that TCS findings with abnormal raphe nucleus echogenicity can be a good indicator of weight loss and depression in patients with de novo PD.
INTRODUCTION
In the natural course of Parkinson’s disease (PD), various symptoms contribute to the burden of patients and lower their quality of life. Of the various non-motor symptoms of PD, we have focused on changes in body weight and body mass index (BMI). Weight loss frequently occurs in PD, and low BMI is associated with malnutrition and low bone mineral density, which, in turn, leads to vulnerability to infection, bone fracture, and motor impairment.1,2 Depression and cognitive decline are associated with weight loss; however, other factors such as hyposmia, dysphagia, visual hallucination, and dopaminergic adverse effects are additional contributors to weight loss, especially in PD patients.3-5 We sought to investigate the relationships among depression, cognitive decline, and low BMI, which individually and synergistically may lead to inactivity in patients with PD despite all of them being non-motor symptoms.
Several studies have hypothesized that depression is one of the important factors in weight loss in PD. However, studies about the relationship between depression and BMI have not been frequently reported.4,5 Dementia is not an uncommon comorbidity in PD patients, with an estimated frequency of as high as 27–78%.6 Low BMI is a risk factor of cognitive decline and may precede the diagnosis of dementia in the elderly.7,8 The application of transcranial sonography (TCS) with respect to the mesencephalic midline may be useful in detecting depression, a risk factor for the development of PD.9
Therefore, we investigated the association of BMI, depression, and cognitive decline using TCS in de novo PD patients. Our hypothesis was that brainstem raphe (BR) echogenicity on TCS is associated with depression and dementia in PD patients.
SUBJECTS AND METHODS
1. Patients
For this study, patients presenting to the PD clinic of Sanggye Paik Hospital between January 2015 and January 2018 were screened (Fig. 1). Patients were eligible for this study if they had de novo PD and were aged ≥40 years. The criteria of the UK Parkinson’s Disease Society Brain Bank were strictly applied in the diagnosis of PD.10 The patients’ demographics, symptom progression, and motor disabilities were documented at baseline. BMI was calculated by dividing body weight (in kilograms) with the square of height (in meters). Patients were categorized as underweight (BMI <18.5 kg/m2), normal weight (18.5–24.9 kg/m2), overweight (25–29.9 kg/m2), or obese (≥30 kg/m2), and these four categories were used for subgroup analysis.

Trial profile.
2. Transcranial sonography measurement
The TCS methods of BR echogenicity measurements have been previously published in a study conducted in the same patient group as in the present study.11 In brief, high-resolution B-mode ultrasound measurements of the BR were performed using a Siemens Acuson S1000 scanner (Siemens Healthcare GmbH, Erlangen, Germany) with a 2.0–3.5 MHz transducer. At the axial scanning plane, the image can be set at the midbrain level. After finding the butterfly-shaped mesencephalic midline and freezing the image, BR echogenicity was semiquantitatively evaluated. The reference point for rating BR echogenicity was the adjacent highly echogenic red nucleus. A rating of grade I was given when the BR was not visible (Fig. 2A). Grade II indicated slightly echogenic or interrupted BR (Fig. 2B), and grade III was applied for the same or increased BR echogenicity compared with the red nucleus (Fig. 2C). In this study, grade I or II was categorized as abnormal BR echogenicity and grade III as normal. An experienced physician conducted all measurements according to a standardized manual of operations. All subjects provided signed informed consent, and the study was approved by the local Institutional Review Board (2019-06-016).
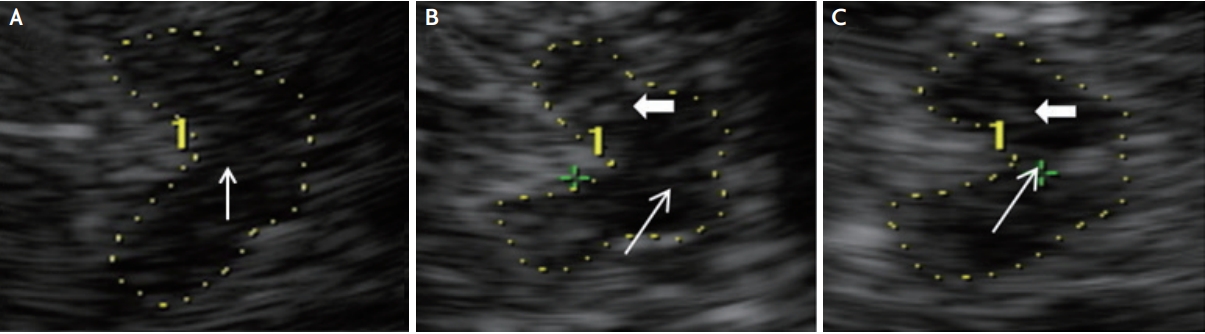
Sonographic images of corresponding midbrain axial sections in three subjects. The butterfly-shaped midbrain was encircled for better visualization. Thick arrows indicate red nuclei, whereas the thin arrows indicate the brainstem raphe (BR). (A) A subject without visible BR (grade I). (B) A subject with slightly echogenic/interrupted BR (grade II). (C) A subject with normal BR echogenicity (grade III).
3. Statistical analysis
Variables were tested for normality using the Kolmogorov-Smirnov test. The baseline parameters of each group were analyzed using an independent-sample t-test or the Mann-Whitney U-test for continuous variables. Categorical data were examined using chi-square analysis.
Pearson’s and Spearman’s correlation coefficients were calculated to evaluate the correlations of BR echogenicity with baseline demographics and neuropsychological assessments. Multivariate linear regression models were used to investigate the relationships between significant univariate variables. A multivariate analysis using all variables and a partial correlation analysis based on calculated residuals from regressing the BMI and HAM-D score on BR echogenicity were performed with p values of <0.05 in the univariate analysis. Descriptive data were expressed as number (percent) or mean±standard deviation. Statistical analyses were performed using SPSS version 25.0 for Windows (IBM, Armonk, NY, USA).
RESULTS
Fig. 1 shows the patient flow and identifies the reasons for exclusion from the study. A total of 165 patients met the inclusion criteria and were enrolled in this study. The baseline characteristics of the study population are shown in Table 1. The mean patient age was 68 years, and 61% were women. Of them, 19% had a history of hypertension, 13% had a history of diabetes, 10% had a history of hypercholesterolemia. The mean duration of disease at recruitment was 1.4 years. The mean Hoehn and Yahr stage was 1.7, and the mean total Unified Parkinson’s Disease Rating Scale (UPDRS) (I–III) score was 31. The mean scores for the Mini-mental State Examination and Montreal Cognitive Assessment (MoCA) tests were 26 and 22, respectively. There were no significant differences in these clinical parameters between the normal and abnormal BR echogenicity groups. Patients with abnormal BR echogenicity showed significantly higher Hamilton Depression Rating Scale (HAM-D) score and lower PD sleep scale score and BMI than patients with normal BR echogenicity, suggesting that abnormal BR echogenicity was associated with depression and low body weight (Fig. 3).

Baseline characteristics of enrolled patients grouped by brainstem raphe echogenicity
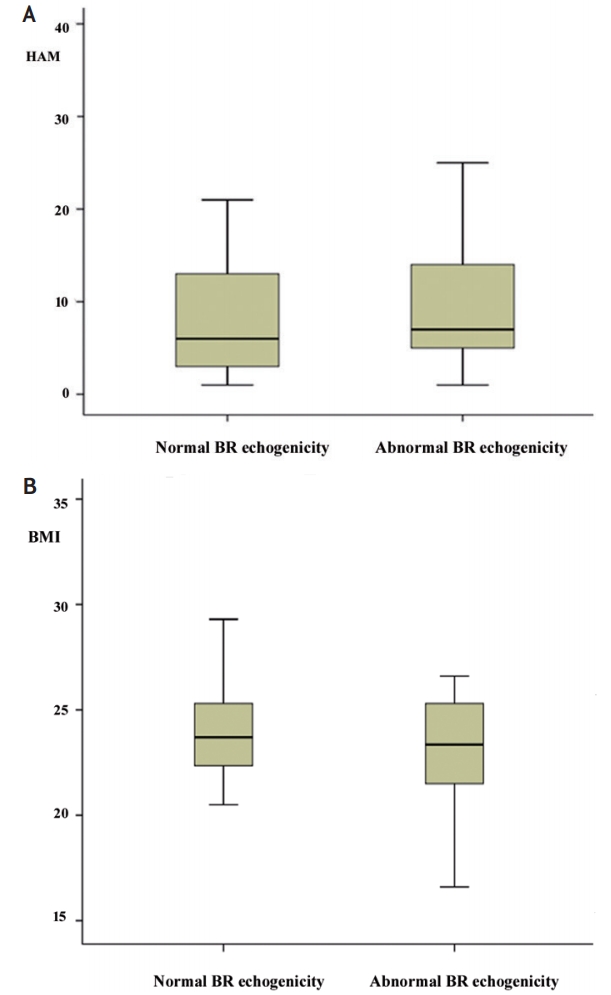
(A) Patients with abnormal brainstem raphe (BR) echogenicity showing significantly higher Hamilton depression rating scale score and (B) lower body mass index than patients with normal BR echogenicity, suggesting that abnormal BR echogenicity is associated with depression and low body weight.
With respect to the HAM-D score, higher Hoehn and Yahr stage, UPDRS I–III and UPDRS III score, non-motor symptom score, PD Questionnaire 39 score, lower MoCA score, and abnormal BR echogenicity were significantly related to higher HAM-D scores (Table 2). Multivariate linear regression analysis showed that higher UPDRS I–III (β=0.489, p=0.002) score and abnormal BR echogenicity (β=0.19, p=0.031) were significantly associated with a higher HAM-D score. No clinical parameters were related to BMI; however, a trend toward higher HAM-D scores was observed in low BMI patients (r=-0.116, p=0.082) (Table 2). There was no significant relationship between BMI and HAM-D score among each BMI subgroup. However, BR-echogenicity-adjusted scatterplots of the relationship between HAM-D score and BMI showed that the HAM-D score was inversely related to BMI in de novo PD patients (r=-0.217, p=0.026) (Fig. 4).

Correlation analysis of HAM-D score or BMI with baseline characteristics
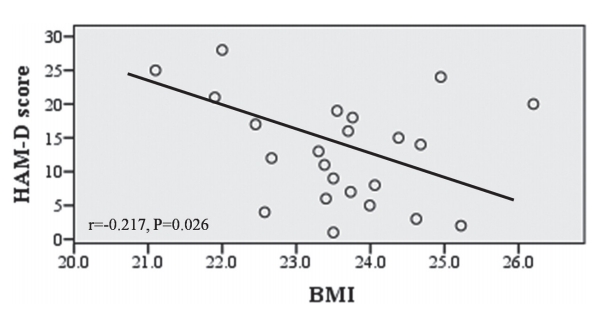
Brainstem raphe (BR)-echogenicity-adjusted scatterplots of the relationship between Hamilton depression rating scale (HAM-D) score and body mass index (BMI). X-axes are based on calculated residuals from regressing BMI on BR echogenicity. Y-axes are based on calculated residuals from regressing HAM-D score on BR echogenicity. r=Pearson’s partial correlation coefficient.
DISCUSSION
In this study, we found that patients with abnormal BR echogenicity had a higher HAM-D score and lower BMI than patients with normal BR echogenicity. The finding that abnormal BR echogenicity was related to a higher HAM-D score supports our previous result.9 However, this is contradictory to the results of previous studies that showed no correlation between the severity of depression and reduction in raphe nucleus (RN) echogenicity.12,13 Additionally, in our study, the HAM-D score and BMI showed inverse relationships in BR-echogenicity-adjusted plots in PD patients. Our results suggest that depression is one of the important factors of weight loss in PD patients, as reported in previous studies.4,5
Dorsal RN is known as one of the main sources of serotonergic innervation and has been shown to play a core role in depression in PD,14 although the histochemical correlation with respect to altered RN echogenicity is not well known. Appetite regulation has also been associated with the serotonergic system,15 as proven by an imaging study.16 On the basis of the serotonergic hypothesis, our study indicates that abnormal RN echogenicity is related to lower BMI and higher HAM-D score in PD patients, which means that weight loss and depression can be seen in patients with abnormal RN echogenicity.
The other point that we were interested in was the relationship between cognitive disorder and BMI, as assessed using TCS. We were unable to find a relationship between abnormal RN echogenicity and cognitive decline. Moreover, cognitive decline was not related to BMI abnormality. However, the MoCA score was lower in patients with higher HAM-D scores. In a previous report, the low BMI group showed lower cognitive function than the stable BMI group, especially at the 36th month of follow-up, which suggested that decreased BMI during the initial 6 months of follow-up in PD patients might be a useful indicator of the future risk of dementia.17 Some prospective longitudinal observational studies about cognitive function changes according to BMI changes in elderly subjects have been previously conducted. Those studies showed that elderly persons with a higher BMI or a slower rate of BMI change had a lower risk of dementia.8,18-20 Three major substances (insulin-like growth factor-1, leptin, estrogen) play important roles in BMI and cognition.21 Among them, leptin level was lower in PD patients with decreased BMI than in normal control subjects.22 Unfortunately, we could not find an association between cognitive decline and abnormal RN echogenicity or BMI changes.
This study had some limitations. First, there are no follow-up data and, therefore, we cannot demonstrate whether patients will exhibit changes in cognitive function or BR echogenicity after BMI changes. Second, the temporal window rate, which is known to be higher especially in Asians, was poor in the TCS study, which prevented more patients from participating in the current study. Despite these limitations, this study was a cross-sectional study in de novo PD patients. Thus, it provides evidence free from the bias of PD medications in patients affected with depression or cognitive decline.
In conclusion, this study suggests that depression is related to weight loss in patients with PD and that TCS findings with abnormal RN echogenicity can be a good indicator of weight loss in patients with PD and depression.
Notes
Conflicts of Interest
No potential conflicts of interest relevant to this article was reported.