Neurosonology for Unconscious or Neurocritically Ill Patients
Article information
Abstract
Evaluating unconscious patients is a diagnostic and therapeutic challenge for emergency neurology practitioners and critical care neurologists. Although much of the underlying pathology of altered mental status can be life-threatening, it is also potentially reversible with timely interventions. Thus, thorough neurological exams and rapid neurological imaging are needed for accurate diagnosis. Ultrasound is a safe and effective form of imaging that can assist in the diagnostic process as a sole modality if advanced imaging is not available or as an adjunct technique that can provide further information regarding the temporal course of the patient’s condition. In particular, transcranial Doppler ultrasound (TCD) can be used to detect intracranial large artery occlusions and aid in selecting patients eligible for reperfusion therapy. TCD-based information can also be used to monitor vasospasm after subarachnoid hemorrhage. Furthermore, TCD, as well as other forms of ultrasound, can detect increases in intracranial pressure noninvasively. Bedside ultrasound of the cardiovascular and thoracic systems can be also performed in a sequential framework for goal-directed therapy in the neurocritical care unit. In this review, we discuss the use of ultrasound in such situations.
INTRODUCTION
Altered mental status is a common chief complaint of patients who present to the emergency department and a frequent reason for neurological consultation.1 The most common discharge etiologies accounting for altered mental status are neurologic (28%) and toxicologic (21%), followed by trauma (14%), psychiatric (14%), infectious (10%), endocrine/metabolic (5%), pulmonary (3%), oncologic (3%), cardiovascular (1%), gastrointestinal (1%), and renal (1%).1 The extreme form of altered mental status is coma, characterized by the absence of arousal and awareness of self and environment, lasting for more than 1 hour.2 In such patients, timely medical and surgical interventions can be life-saving, and the initial evaluation of such patients is critical for establishing a correct diagnosis.2 Thus, the Emergency Neurological Life Support Guidelines suggest an algorithm for the initial assessment and treatment of patients with coma based on general physical examinations, airway stabilization, breathing, circulation, cervical spine precautions, neurological assessments, recommended stat labs, and brain imaging.2
According to these guidelines, brain computed tomography (CT) and CT angiography are recommended as the primary imaging modality. Brain imaging helps clinicians identify the structural etiologies of coma including cerebral infarction, intracranial hemorrhage, brain masses, cerebral edema, and acute hydrocephalus causing increased intracranial pressure (ICP). The acquired information regarding vascular patency is useful for administering reperfusion therapies for acute stroke or predicting vasospasm in patients with subarachnoid hemorrhage (SAH). Bedside neurosonology can aid in the evaluation and management of such patients. In certain situations, it may even be preferred over CTbased imaging. For example, in primary care or prehospital settings, neurosonology is much more accessible than is brain CT. In addition, ultrasound is more practical for situations in which information regarding serial temporal changes of intracranial parameters are required.
Point-of-care cardiothoracic ultrasound is another technique often employed for neurocritical patients. Neurocritical patients frequently exhibit other medical problems. Hence, the timely evaluation of cardiac comorbidities3,4 and airway or pulmonary problems5 is essential. Furthermore, evaluations of a patient’s hemodynamic status is helpful in situations where cerebral perfusion pressure optimization is needed.6 Point-of-care ultrasound can assists in the diagnosis and monitoring of such patients.
This review describes the various ultrasound methods that are used to evaluate patients with altered mental status or the neurocritically ill, with a focus on the detection of large vessel occlusion (LVO) in ischemic stroke, monitoring of vasospasm after SAH, noninvasive identification of ICP, and practical use of point-of-care cardiothoracic ultrasound for neurocritical patients.
RAPID DETECTION OF LVO IN ISCHEMIC STROKE
The detection of intracranial LVO by transcranial Doppler ultrasound (TCD) focuses on the Thrombolysis In Brain Ischemia (TIBI) grade,7 which consists of six grades (Fig. 1).8 Key findings to be considered are a >30% decrease in mean flow velocity, flattening of systolic acceleration, absence of diastolic flow, or no detectable flow. In this grading system, TIBI waveforms of grades 0 (no flow), 1 (minimal), 2 (blunted), and 3 (dampened) are considered representative of occlusions.7 The TIBI grade can also be affected by the insonated arterial section and its distance from the arterial occlusion.9 Secondary findings, including an increase in flow velocity of the adjacent arterial vasculature, the development of prominent collaterals, or flow reversal distal to the occlusive segment, may support identification.10,11 Using both primary and secondary findings, a TCD study including 190 patients identified arterial occlusion with an overall sensitivity of 83.0% and specificity of 94.4% compared to digital subtraction angiography or magnetic resonance angiography. The findings were higher for middle cerebral artery (MCA) (sensitivity, 93%; specificity, 98%) and distal internal carotid artery (ICA) (sensitivity, 81%; specificity, 96%) occlusions, and lower for basilar artery occlusions (sensitivity, 60%; specificity, 96%).12 The method of urgent combined carotid/transcranial ultrasound testing for detection of LVO patients with acute cerebral ischemia has also been developed. Simultaneous evaluation by a stroke neurologist and experienced neurosonographer enables focused TCD and carotid/vertebral duplex scans to be performed within 10 minutes. In a study of 150 consecutive patients, this fast-track neurovascular ultrasound examination detected lesions amenable for interventional treatment, including occlusion, near occlusion, stenosis >50%, or thrombi, in arteries with 100% sensitivity and 100% specificity.13 Detailed methods for fast-track neurovascular ultrasound are provided in Table 1. The power motion-mode Doppler (PMD) window can also aid in diagnosing arterial occlusions, in which a high resistance signature with absent diastolic flow suggests arterial occlusion (Fig. 2). Using the previously mentioned TCD criteria and PMD criteria, occlusion was detected with 100% sensitivity and 94.5% specificity in the anterior circulation, while the sensitivity was lower in the posterior circulation (sensitivity, 93%; specificity, 98%).14
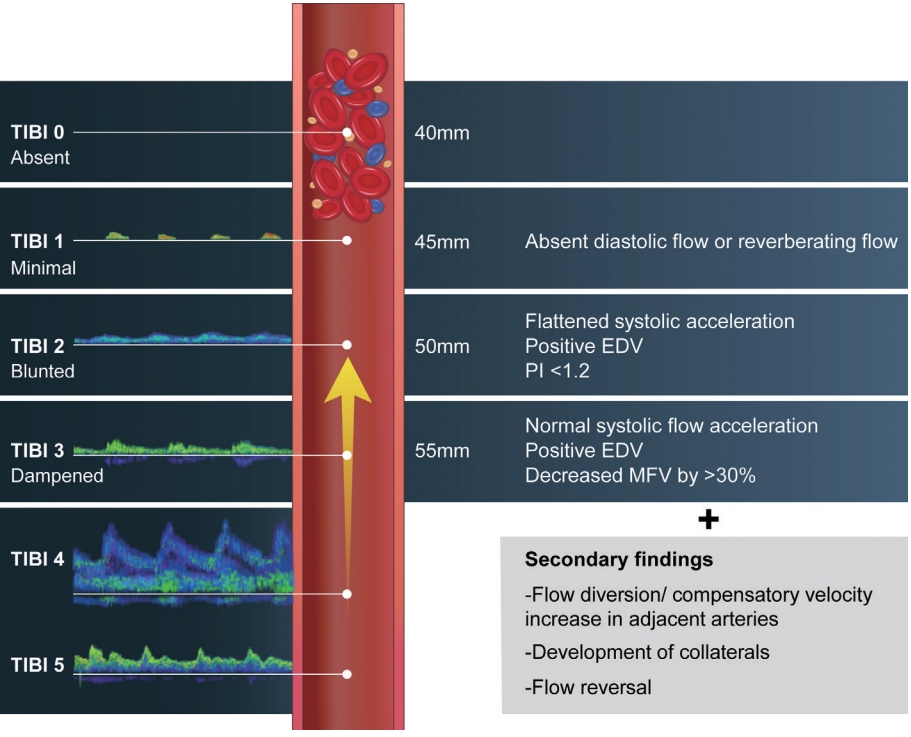
The TIBI grade and diagnosis of arterial occlusions.7-9 This figure assumes an arterial occlusion due to thrombus at the M1–M2 bifurcation (40 mm). Presence of TIBI grades 0–3 in the vessel supplying the ischemic territory is the primary finding of arterial occlusions. This can also be effected by the distance to occluded segment from the insonation point. TIBI; Thrombolysis in Brain Ischemia, EDV; end diastolic velocity, MFV; mean flow velocity, PI; pulsatility index.
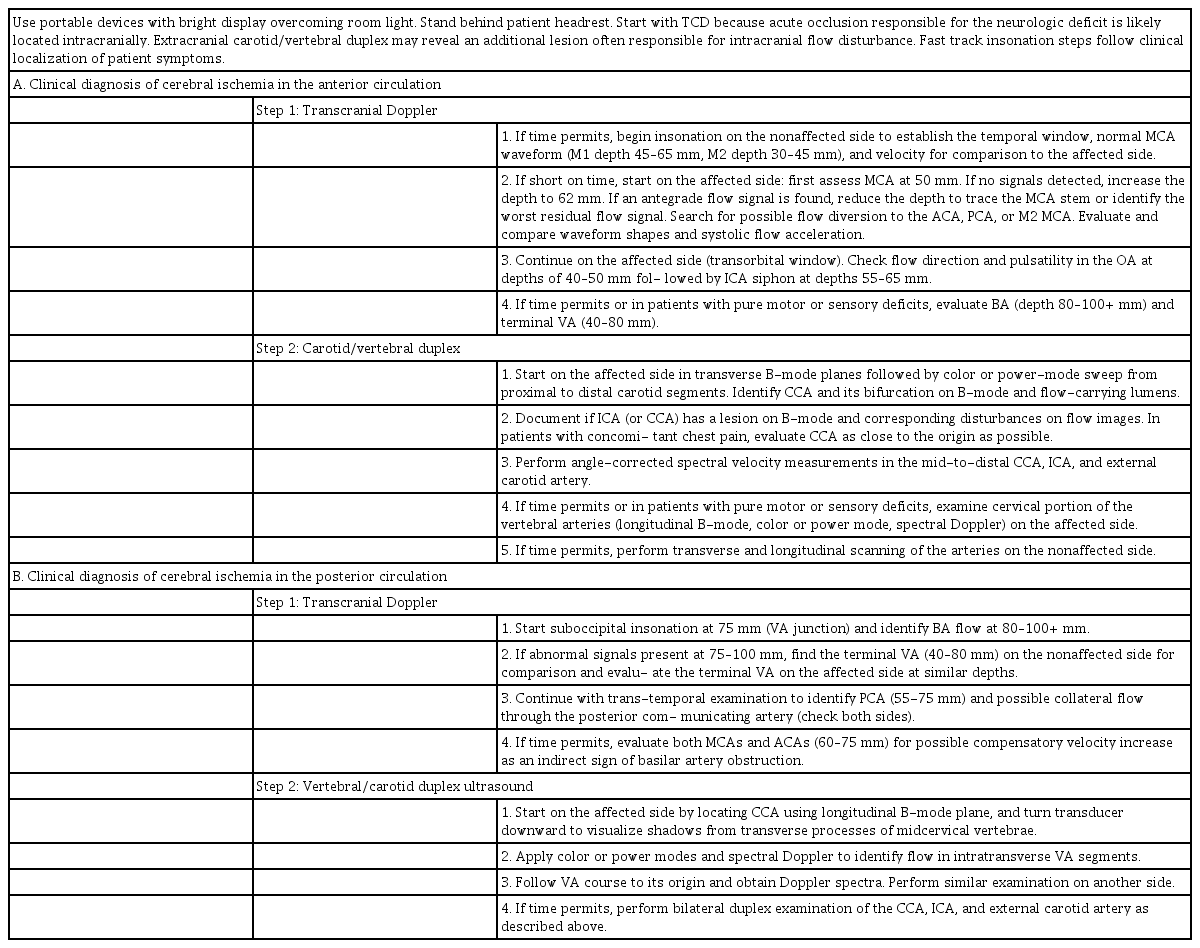
PMD-based detection of arterial occlusions.14 Before recanalization (left), PMD shows a high-resistance characteristic flow track (yellow markers) with blunted flow in the single-gate spectral analysis. After recanalization, PMD shows a low-resistance characteristic flow tract with improvement of single-gate spectra. PMD; power motion-mode Doppler, ICA; internal carotid artery.
Another advantage of TCD is that it can be hand-carried to be performed at bedside. The success of endovascular treatment trials has increased the demand for identifying LVO patients.15-19 Earlier identification in prehospital settings will aid in the triage of patients needing comprehensive stroke centers and increase the number of patients that would benefit from endovascular therapy.20 The Regensburg stroke mobile project focuses on such issues, and the authors hypothesized that a neurologist equipped with a portable ultrasound device would be able to achieve diagnostic accuracy “in the field” that is similar to that achieved with in-hospital advanced neuroimaging (CT angiography and magnetic resonance angiography). Transcranial color-coded sonography (TCCS) assessments have been performed in prehospital “911” emergency stroke situations, wherein portable duplex ultrasound devices were used to visualize the bilateral MCAs. In 113 eligible patients, TCCS had a sensitivity of 90% and specificity of 98% for detecting M1 occlusions.21 However, 10 occlusions were identified from among the 102 performed TCCS procedures, which is a low yield considering the clinical effort. Furthermore, up to 20% of patients have poor temporal windows, which is another limitation.22 Utilizing prehospital stroke scales to predict LVO, such as the Field Assessment Stroke Triage for Emergency Destination (FAST-ED).23 or Stroke vision, aphasia, neglect (VAN).24 assessment, and preferentially performing TCD for patients in whom LVO is highly suspected may be able to overcome such limitations.
Neurosonologic examinations may also play a role in monitoring patients after recanalization procedures. Indeed, TCD can be used as both a surrogate marker for reperfusion and a method for detecting embolism, thrombosis, hypoperfusion, and hyperperfusion.25 Moreover, carotid duplex tests can aid in evaluating the status of the carotid artery26 or extracranial vertebral artery27 after stenting. Due to alterations of blood flow and vessel compliance, modified criteria for the systolic velocities or ICA/common carotid artery ratio for instent restenosis are used for the ICA.26
MONITORING OF VASOSPASM AFTER SAH
Cerebral vasospasm is a leading cause of morbidity and mortality after aneurysmal SAH. Up to 70% of patients experience angiographic vasospasm, which typically occurs between 5 and 14 days after SAH onset. Symptomatic vasospasm occurs in ~30% of patients. Delayed ischemic neurologic deficits occur in ~50% of patients with angiographic vasospasm.28 Current American Society of Neuroimaging guidelines highlight the utility of TCD for diagnosing cerebral vasospasm in both the anterior and posterior circulation following SAH.25 TCD can be employed to detect vasospasm development before it becomes clinically apparent (days 2–5) and identify progression to the severe spasm phase, when the development of delayed ischemic deficits is the greatest (days 5–12). Thus, TCD findings may assist in the planning of appropriate therapeutic interventions.29 However, there is some debate over the clinical utility of TCD for vasospasm monitoring. A recent meta-analysis by Mastantuono et al.30 revealed conservative results, demonstrating a pooled sensitivity of 66.7% (95% confidence interval [CI], 55.9–75.9) and specificity of 89.5% (95% CI, 80.3–94.7) for TCD in the detection of vasospasm in the MCA. TCCS was not convincingly shown to be more accurate than TCD. The authors concluded that both TCD and TCCS are capable of detecting vasospasm in the MCA, but neither is useful for excluding the possibility of vasospasm. Further, for arteries other than MCA, the usefulness of TCD remains unclear.30
DETECTION OF INCREASED ICP
As the intracranial compartment is covered by thick skull, gold standard methods of measuring ICP are inherently invasive in nature. Invasive ICP monitoring is especially important after severe traumatic brain injury.31 However, due to complications including infection or hemorrhage,32,33 methods of reliably estimating the ICP noninvasively are being developed. Among them, TCD-based detection of cerebral blood flow (CBF) changes and ultrasound-based detection of optic nerve sheath diameter (ONSD) enlargements are readily available, safe, and reliable methods that can be performed at the bedside.34
1. Arterial TCD
The arterial pulsatility index (PI; [peak systolic velocity – end diastolic velocity] / mean flow velocity)35 is a widely investigated variable of TCD measurements for ICP, but studies evaluating its accuracy have shown inconsistent results. In patients with various intracranial disorders with intraventricular catheters, Bellner et al.36 reported that the correlation coefficient between the ICP and PI was 0.828; this method had a sensitivity of 83% and specificity of 99% for detecting ICP >20 mmHg.36 However, in a study of 290 patients with traumatic brain injury, Zweifel et al.37 reported that the correlation between the PI and ICP was 0.31 (p<0.001), while that between the PI and cerebral perfusion pressure (CPP) was –0.41 (p<0.001). The 95% prediction interval of ICP values for a given PI was more than ±15 mmHg and that for CPP was more than ±25 mmHg. Thus, the authors concluded that the overall utility of the TCD PI for assessing ICP and CPP noninvasively is very limited, and only extreme PI values should be used to support decisions for invasive ICP monitoring.37
Schmidt et al.38 assessed a method for ICP assessment by applying a mathematical “black-box” model, in which the intracranial compartment was considered a black-box system, with ICP defined as a response to the incoming arterial blood pressure (ABP) signal. The process of transforming the ABP into an ICP waveform was modified according to changes in the cerebrovascular circulation, which were derived using TCD characteristics. Through this method, the authors achieved noninvasive ICP simulations that closely mimicked the measured ICP curve shapes.38
Other TCD-derived formulas have been generated to obtain noninvasive ICP measurements by estimating the CPP and calculating the ICP based on the assumption that ICP = mean arterial pressure – CPP.34 Czosnyka et al.39 proposed a formula (CPP = mean ABP × diastolic flow velocity / mean flow velocity) based on the observation that in perfusion derangements, diastolic flow velocity drops, whereas the systolic component remains relatively unchanged. Through this formula, the error in estimating the ICP was <10 mmHg in 68% of the measurements.
Estimating the ICP by estimating the CPP via utilizing the concept of critical closing pressure has been also reported. The critical closing pressure denotes a threshold of ABP below which the local microvascular blood pressure is inadequate to prevent collapse and cessation of blood flow. Using TCD, the critical closing pressure can be assessed by comparing the pulsatile waveforms of CBF and ABP. By assuming a linear relationship between CBF and ABP during one cardiac cycle,40 the closing pressure can be estimated, for example, by identifying the intercept point of a regression line between the systolic and diastolic ABP values plotted along the x-axis and the systolic and diastolic CBF values plotted along the y-axis.41 The critical closing pressure is equal to the sum of the ICP and vascular wall tension values.42 Using this method, Varsos et al.43 reported that the noninvasively estimated CPP showed good correlation with the invasively measured CPP (r=0.851, p<0.001), with only a small estimation error when applied to a series of 280 head-injured patients.
Notably, when the four aforementioned methods of measuring ICP through arterial TCD were compared, the PI model reflected the temporal changes in ICP most accurately, while the “black-box” model was the best estimator for ICP as a number.44
2. Venous TCD
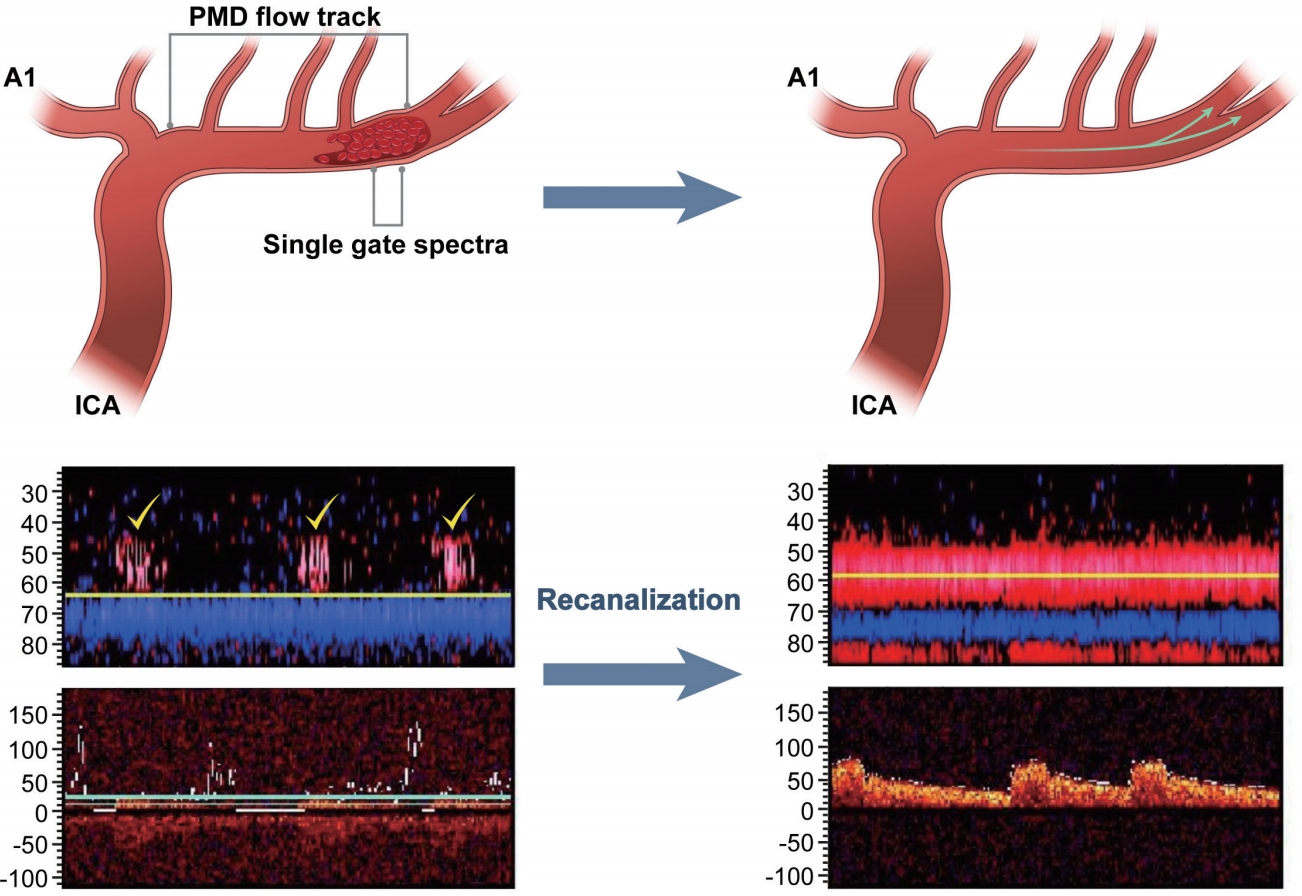
TCD of the venous system has also been evaluated.45 Theoretically, cerebral compliance strongly depends on the compressibility of the venous segment of the vascular bed. During a rise in ICP, venous blood is likely the first volume to be displaced. Venous TCD for the basal vein of Rosenthal46 through the temporal bone window (Fig. 3A) or for the straight sinus.47 through the occipital or transforaminal window is usually performed. A brief modified Valsalva maneuver is performed to confirm the venous origin.45 Using this method, Schoser et al.45 demonstrated that within a certain range of ICP (15–40 mmHg), the maximal venous blood flow velocity in the basal vein of Rosenthal (r=0.645; p<0.002) and straight sinus (r=0.928; p<0.0003) showed linear relationships with ICP. The association between straight sinus systolic velocity and ICP was confirmed by a subsequent study.48 However, this method is limited by difficulties in insonation of the venous sinuses, and venous TCD may not be obtainable in up to 12% (basal vein of Rosenthal) to 28% (straight sinus) of patients.45
Venous TCD46 and two-depth TCD49 for noninvasively measuring ICP. (A) For practical measurements of venous TCD, the temporal window is commonly used to insonate the vein of Rosenthal. (B) A schematic of the noninvasive ICP measurement apparatus. Two-depth TCD detects flow velocity parameters from the extracranial OA and intracranial OA. Pressure is increased in the externally applied pressure chamber to obtain a balance point where the ICP equals the externally applied pressure. TCD; transcranial Doppler, ICP; intracranial pressure, OA; ophthalmic artery.
3. Two-depth TCD
Ragauskas et al.49 reported a novel noninvasive ICP measurement approach that is based on two-depth high-resolution TCD insonation of the ophthalmic artery (OA). In this method, the OA is used as a natural pair of scales, in which the intracranial segment of the OA is compressed by ICP, and the extracranial segment of the OA is compressed by extracranial pressure applied to the orbit (Fig. 3B). The blood flow parameters in both OA segments are approximately the same when extracranial pressure equals ICP. Using this method, the authors reported good accuracy, as indicated by a low mean systematic error (0.12 mmHg; confidence level, 0.98), and high precision, as indicated by a low standard deviation of the paired recordings (2.19 mmHg; confidence level, 0.98). However, this approach requires an additional specific apparatus to measure TCD parameters at both the intracranial and extracranial portions of the OA. Furthermore, it may be of limited use in patients with ocular trauma, severe head injury, or cranial fractures.
4. Optic nerve sheath diameter
The ONSD has been found to be a strong predictor of raised ICP, with high sensitivity and specificity.50 Compared to other noninvasive ICP estimation methods, such as arterial and venous TCD, the ONSD has been proven to have stronger predictive power.48 Further, ONSD measurement is practical due to its noninvasive nature, reproducibility, and relatively low cost.
There is direct communication between the subarachnoid space of the optic nerve and the chiasmatic cistern.51 When ICP rises, cerebrospinal fluid flows towards the subarachnoid space of the optic nerve, which results in expansion of the dural sheath and an increase in the ONSD. This change is most obvious at the anterior segment of the dural sheath, 3 mm behind the globe, making this the preferred position for measurement.52,53 The changes in ONSD are also thought to be a dynamic phenomenon rather than a static indicator of increased ICP,54,55 which makes the use of ONSD assessments more practical at the bedside.
As a general approach, a value >5.0–6.0 mm is routinely used as an indicator of intracranial hypertension. However, in their meta-analysis and review, Robba et al.56 pointed out that there is heterogeneity in the threshold for defining intracranial hypertension among studies; thus, a clear cut-off value for ONSD cannot be identified.
The inter-individual variation in ONSD is considerable. Apart from increased ICP, a number of baseline factors can affect the ONSD. Ethnicity,57 sex,58 and body mass index57 are known to be associated with ONSD. In particular, ONSD shows a strong correlation with eyeball transverse diameter (ETD).59 Hence, using the ONSD/ETD ratio may be a better marker of elevated ICP. This ratio not only corrects for the ETD, but also becomes independent of demographic factors such as sex, height, weight, and body mass index.60 A mean ONSD/ETD ratio of 0.18 (95% CI, 0.18–0.18) is the established value for healthy Koreans.60
The dynamic changes in ONSD can also be evaluated, rather than just a single ONSD measurement. There is evidence that ONSD increases as ICP increases and decreases as the elevated ICP decreases.61 With such accumulating study results, ONSD changes may be used as a dynamic marker of ICP changes. Like invasive ICP monitoring, ONSD changes can guide the implementation of therapeutic interventions.62
While ONSD measurement is a relatively simple procedure, care must be taken to ensure their accuracy. With the patient in the supine position, the linear transducer is placed over the upper eyelid. In this view, echogenic retrobulbar fat is insonated behind the globe. The optic nerve is observed as a sharply defined homogenous low-reflection band, and the nerve sheath is observed as a bilateral thin hypoechoic line that is lateral and parallel to the nerve.63 The optic nerve is measured 3 mm posterior to the globe. It is important to measure the ONSD in a line perpendicular to the direction of the optic nerve. Bilateral ONSD measurements and coronal plane measurements should be performed for accuracy. An average of two or three measurements from each side should be obtained for quality control (Fig. 4).
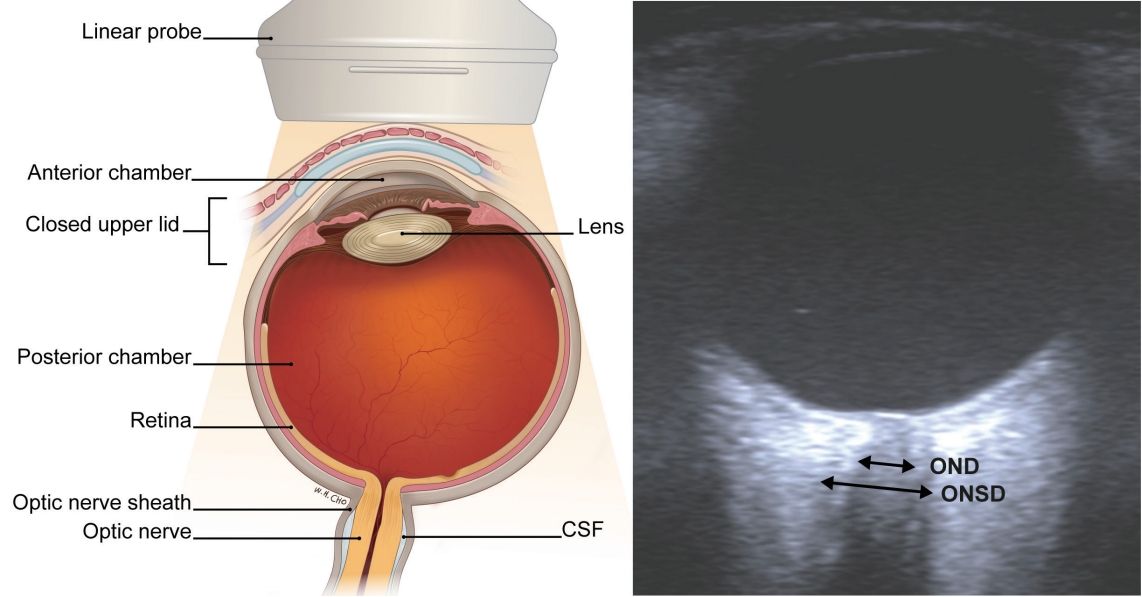
Measurement of the ONSD. ONSD; optic nerve sheath diameter, CSF; cerebrospinal fluid, OND; optic nerve diameter.
POINT-OF-CARE CARDIOTHORACIC ULTRASOUND FOR NEUROCRITICAL CARE PATIENTS
Point-of-care ultrasonography at the bedside may involve the use of a series of focused ultrasonographic examinations to efficiently diagnose or exclude certain conditions in patients presenting with particular symptoms, including hypotension, chest pain, or dyspnea.64 Alternatively, it may aid the physician in diagnosing and monitoring critically ill patients. Point-of-care ultrasonography is especially valuable in patients requiring neurocritical care, due to the occurrence of frequent systemic comorbidities in these patients. Ultrasound can be used at the bedside in a variety of situations including for the 1) evaluation of cardiothoracic comorbidities such as atrial septal defect and patent foramen ovale, global/segmental ventricular dysfunction, pericardial effusion/cardiac tamponade, and sources of emboli upon admission to the neurocritical care unit;65 2) differential diagnosis of acutely developed symptoms including hypotension, chest pain, and dyspnea;66,67 3) serial follow-up of pulmonary or cardiologic dysfunctions such as improvement or aggravation of pulmonary edema or pneumonia; and 4) evaluation and management of volume status in situations where cerebral perfusion pressure optimization is needed, including hypertensive therapy for ischemic stroke68 or preventing delayed cerebral ischemia after SAH.69
For these patients, lung ultrasound, echocardiography, and vascular ultrasound (inferior vena cava [IVC], aorta, and deep veins of the lower extremity) can be sequentially performed.67,70 While there is no universally accepted sequence, scanning of the lung and IVC with the abdominal aorta, followed by heart and abdominal evaluations when required, is practical [71]. Sonography of the lower-extremity deep veins is performed in clinical situations when needed. Throughout this process, evidence of the “8 Es,” a mnemonic for the eight potential goals to identify, is sought.50 The eight Es are empty thorax (pneumothorax), edematous lung, extended focused assessment with sonography for trauma (E-FAST), effusion (pericardial), equality (right ventricular [RV] dysfunction), ejection fraction (left ventricular [LV] dysfunction), exit (aorta), entrance (IVC), and endocardial movements.
Point-of-care ultrasonography can be performed practically using two probes (Fig. 5). The first step uses a curvilinear probe and starts with lung ultrasound. For rapid assessment, lung ultrasound 72 can be performed at two anterior lung points and one posterolateral alveolar and/or pleural syndrome (PLAPS) point for each lung. Five sonographic lung patterns can be distinguished: normal lung pattern, pneumothorax, interstitial syndrome, alveolar consolidation, and pleural effusion.71 A normal lung pattern (Fig. 6A) is defined as A-lines (an artifact formed by repetition of the pleural line) with lung sliding (dynamic movement of the pleural line, which moves synchronously with respiration) in the anterior lung, without alveolar consolidation or pleural effusion at the PLAPS point. A normal lung pattern may be truly normal or observed in airway disease.73 or pulmonary embolism74 in cases of dyspnea. Diffuse interstitial syndrome pattern is defined as multiple bilateral B-lines (Fig. 6D) with at least two positive scans on each side of the thorax.75 Abnormal B-lines are classified as ≥3 lines per intercostal space, while ≤2 lines is considered normal.71 Diffuse interstitial syndrome may indicate pulmonary edema, pulmonary fibrosis, or interstitial pneumonia.76 Combined echocardiographic evidence of LV dysfunction with bilateral B-lines may be indicative of cardiogenic pulmonary edema. A sonographic diagnosis of pneumothorax comprises three steps: 1) absence of lung sliding (presence of lung sliding is observed as a seashore sign [a stratified pattern above the pleural line, and sandy appearance below the pleural line in M-mode], while the absence of lung sliding is observed as a stratosphere sign [homogeneous stratified pattern in M-mode]; Fig. 6B;77) 2) absence of B-lines and presence of A-lines; and 3) confirmation of lung points78 (alternating seashore and stratosphere signs). Pleural effusion or alveolar interstitial patterns can be identified at the PLAPS point (Fig. 6C). Consolidated lung regions are visualized as tissue-like patterns.
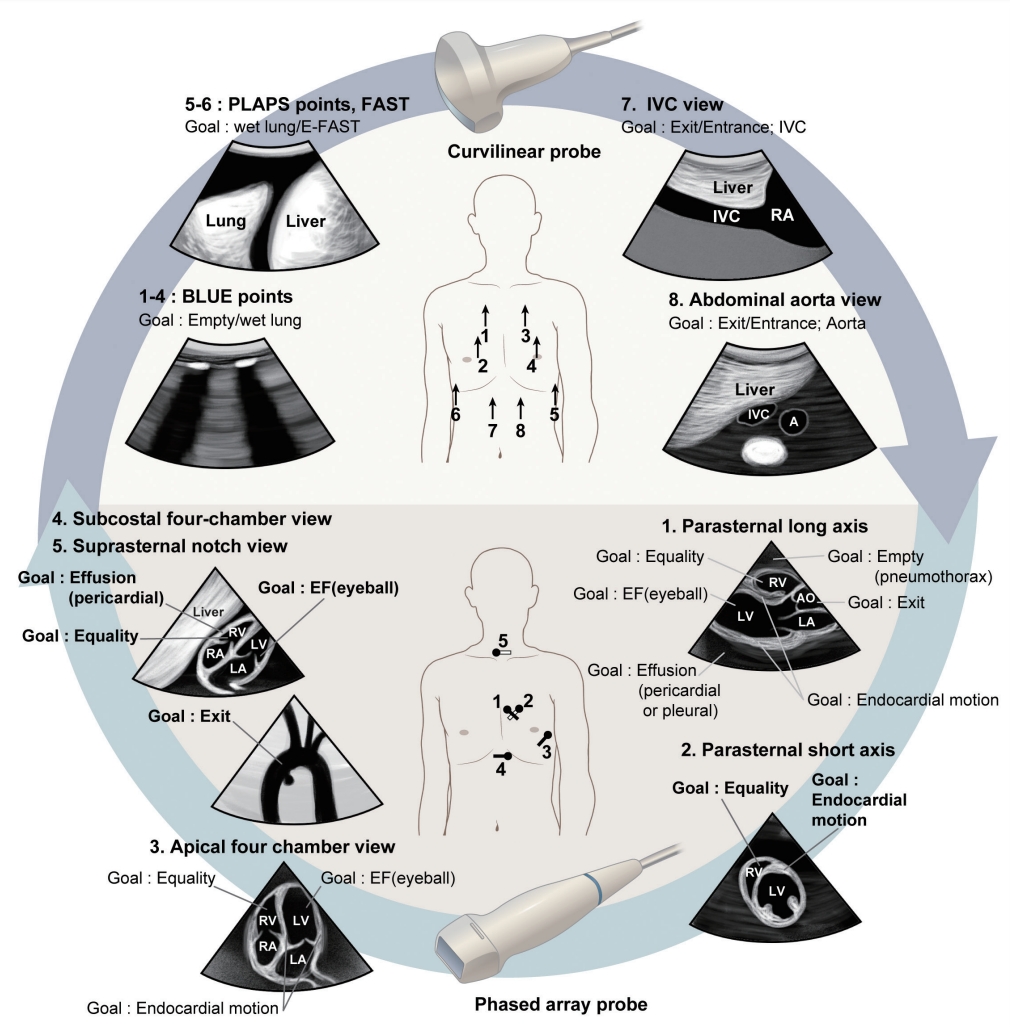
Basic point-of-care cardiothoracic ultrasound for managing patients in the neurocritical care unit. A series of examinations including lung ultrasound, echocardiography, and vascular ultrasound (IVC and aorta) can be performed for patients in the neurocritical care unit (modified from Ahn et al.67). Throughout this process, evidence of the “8 Es,” a mnemonic for the eight potential goals to identify, is sought according to the clinical situation. The 8 Es are empty thorax (pneumothorax), edematous lung, extended focused assessment with sonography for trauma (E-FAST), effusion (pericardial), equality (RV dysfunction), ejection fraction (LV dysfunction), exit (aorta), and entrance (IVC), and endocardial movements. BLUE; bedside lung ultrasound in emergency, PLAPS; posterolateral alveolar and/or pleural syndrome, IVC; inferior vena cava, EF; ejection fraction, LV; left ventricular, RV; right ventricular.

Lung ultrasound images of various conditions. (A) Lung sliding (blue arrows) and A-lines (yellow arrows) are the hallmarks of a normal lung pattern. (B) Lung sliding can be confirmed by seashore signs in M-mode (left), while the absence of lung sliding can be confirmed with stratosphere signs (right), as was observed in a patient with pneumothorax. (C) Pleural effusion (*) with alveolar consolidations (†). (D) B-lines (yellow arrowheads) are suggestive of pulmonary interstitial syndrome, and B-lines observed bilaterally in a diffuse pattern at the anterior chest may indicate pulmonary edema or interstitial pneumonia.
Next, vascular ultrasound of the IVC and aorta is performed. The IVC comprises the entrance to the heart, and sonographic IVC assessments can be used to predict preload or volume responsiveness. Respiratory variation can be evaluated by the caval index ([(IVC expiratory diameter – inspiratory diameter) / IVC expiratory diameter] × 100) (Fig. 7A). The predictive power of the caval index is consistent in intubated patients. In septic shock patients, respiratory variation in the IVC diameter of >12% predicted increases in cardiac output after volume loading with positive and negative predictive values of 93% and 92%, respectively.79 In another study, a caval index threshold of 18% discriminated fluid responders and non-responders with 90% sensitivity and 90% specificity.80 However, its predictive ability is less powerful for patients with spontaneous breathing. Initial reports showed that a caval index value >50% suggested a right atrial pressure of <10 mmHg.81 In contrast, a more recent study revealed that bedside sonographic measurement of the caval index during spontaneous breathing did not predict fluid responsiveness in a heterogeneous emergency department population.82 Currently, the optimal approach for measuring the caval index in patients with spontaneous breathing is to instruct them to “sniff,” resulting in brief, rapid expiration.83 Practically, the combined use of the maximal IVC diameter and collapsibility is recommended by the European Association of Echocardiography.84 An IVC diameter ≤2.1 cm that collapses >50% with a sniff suggests a normal right atrial pressure of 3 mmHg (range, 0–5 mmHg), whereas an IVC diameter >2.1 cm that collapses <50% with a sniff suggests a high right atrial pressure of 15 mmHg (range, 10–20 mmHg). For indeterminate cases in which the IVC diameter and collapse do not fit this paradigm, an intermediate value of 8 mmHg (range, 5–10 mmHg) may be used. Preferably, secondary indices of elevated right atrial pressure should be integrated (Table 2).84 Insonation of the abdominal aorta can be performed to evaluate the exits of the heart and to reveal evidence of aortic dissection or aneurysm.
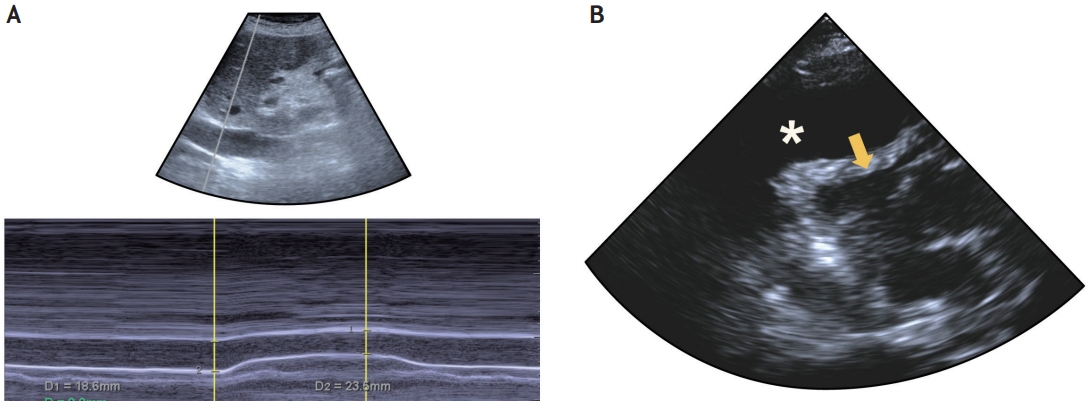
Examples of vascular ultrasound of the IVC and echocardiography. (A) The IVC comprises the entrance to the heart, and its sonographic assessment can predict preload or volume responsiveness. Respiratory variation of the IVC can be used, and the caval index is calculated using the IVC expiratory and inspiratory diameters. (B) Parasternal long axis view of a patient with dyspnea is shown. The image shows a large amount of pericardial fluid (*) and right ventricular collapse (yellow arrow), suggestive of cardiac tamponade. IVC; inferior vena cava.

Using the phased array probe, echocardiography can be sequentially performed. Potential targets to search for in neurocritical care patients are pericardial effusion with or without tamponade physiology (diastolic right ventricle collapse), pulmonary embolism causing RV dysfunction (RV enlargement and paradoxical interventricular septal movement), LV systolic dysfunction or acute myocardial infarction (LV and RV regional wall motion abnormalities) and mechanical complications (papillary muscular rupture and LV wall rupture), and signs of hypovolemic or distributive shock (hypokinetic small-sized left ventricle or hyperkinetic normal-sized left ventricle).67 The parasternal long axis view can be initially insonated. The global ejection fraction is easily evaluated by eyeballing85 in this view, along with regional wall motion. RV dilatation, paradoxical septal motion, pericardial effusion, and the ascending aorta can also be evaluated. The probe is then turned 90º to the patient’s left shoulder to insonate the parasternal short axis view. In this view, regional wall motion can be closely evaluated. Clues for problems in equality such as RV dilatation or paradoxical septal motion can also be observed in this view. Diseases causing increases in RV pressure, including pulmonary embolism and pulmonary hypertension, would produce RV enlargement and LV compression, resulting in a D-shaped LV.86 In contrast, cardiac tamponade would yield paradoxical diastolic RV collapse (Fig. 7B).87 The apical four-chamber view can subsequently be performed. Overall LV function can be evaluated in this view, along with comparisons of LV to RV size and function or wall motion abnormalities. For patients in whom apical views cannot be obtained due to intubation or postural difficulties, a subcostal four-chamber view can be used. A suprasternal notch view can be employed for evaluating the cardiac exit, especially in patients with chest pain, but assessments in this view do not need to be routinely performed in neurocritical care patients.
Ultrasound is likewise used to diagnose lower-extremity deep vein thrombosis in evaluation of patients with dyspnea who have a normal lung pattern,73 or as a screening procedure in the critical care unit. A protocol utilizing a simplified compression technique at the common femoral vein and popliteal vein has been developed, because in previous studies, almost all cases of deep vein thrombosis involved either the popliteal vein or the common femoral vein.88 A linear probe is generally used, and the femoral vein is insonated from just distal to the femoral triangle to the point at which the common femoral artery bifurcates. The popliteal vein can be visualized in the popliteal fossa, wherein the vein is usually located more superficially to the popliteal artery. If the vein collapses to a thin line upon external pressure, it is presumed to be patent, whereas if the vein does not collapse, it is presumed that the vessel lumen contains a clot (Fig. 8).
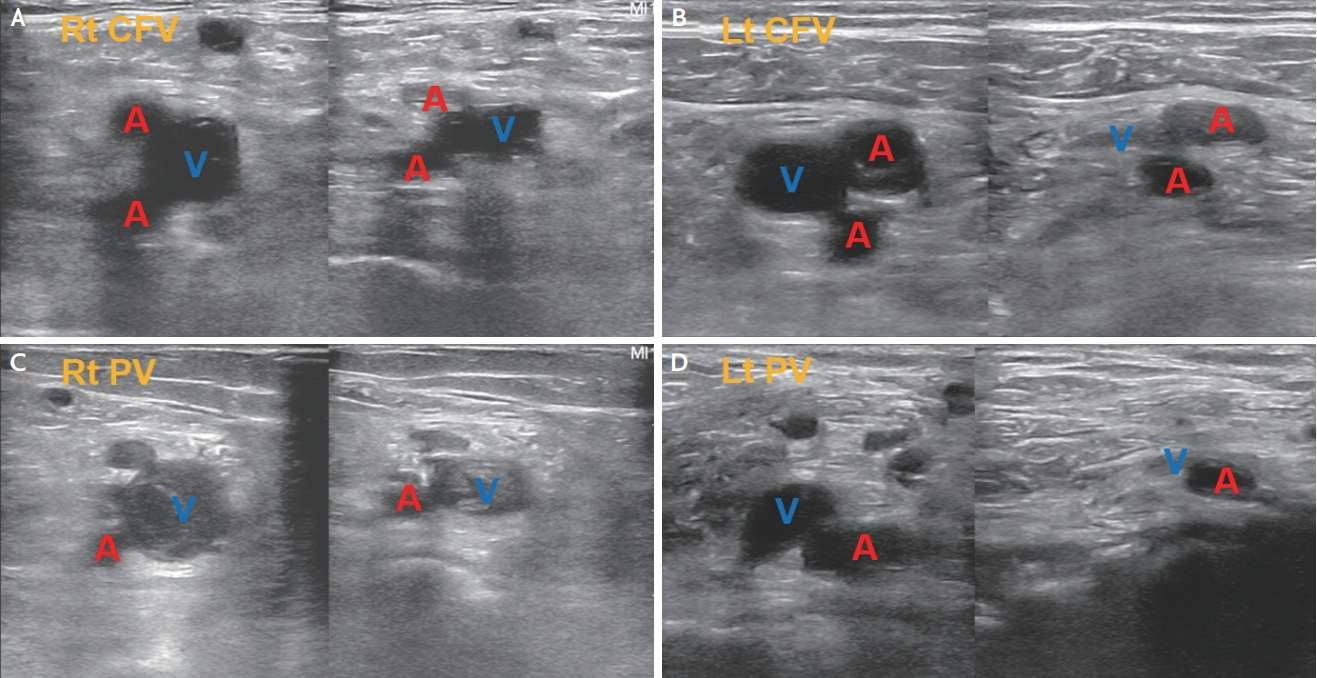
Examples of the compression technique for DVT screening. (A) Insonation at the level of the right common femoral vein. Both the deep and superficial femoral arteries are insonated at this point. The common femoral vein does not show complete collapse under compression, suggestive of the presence of DVT. (B) Insonation at the level of the left common femoral vein, showing complete collapse under compression. (C) Insonation at the level of the right popliteal vein shows incomplete collapse under compression, with a visible thrombus in the lumen. (D) Insonation at the level of the left popliteal vein shows complete collapse under compression. CFV; common femoral vein, A; artery, V; vein, PV; popliteal vein, DVT; deep vein thrombosis.
CONCLUSIONS
Point-of-care ultrasound, including TCD, carotid duplex studies, and orbital and cardiothoracic ultrasound, is an effective tool that can help neurologists diagnose and manage patients presenting with altered mental status, as well as patients in the neurocritical care setting.