Vascular Overload Index Predicts Cerebral Small Vessel Disease in a Neurologically Healthy Population
Article information

Abstract
Background
Arterial stiffness has been suggested as one of the major pathological mechanisms of cerebral small vessel diseases (cSVDs). In this study, we confirmed this hypothesis by evaluating the association between vascular overload index (VOI), which is a physiologically good indicator of arterial stiffness, and cSVD.
Methods
We evaluated participants who visited Seoul National University Hospital Health Promotion Center for health check-ups between 2006 and 2013. VOI was calculated by the following formula: VOI (mmHg)=1.33×systolic blood pressure -0.33×diastolic blood pressure-133.3. cSVDs were measured including white matter hyperintensity (WMH), lacunes, and cerebral microbleeds (CMBs). We quantitatively measured the WMH volume and rated the presence and number of lacunes and CMBs qualitatively.
Results
A total of 3,231 participants were evaluated (mean age 57±9 years, male sex 53.9%). In multivariable linear regression analysis, VOI was significantly associated with WMH volume after adjusting confounders (β=0.004, 95% confidence interval=0.002–0.006). VOI also showed a close association with lacunes in multivariable logistic regression analysis (adjusted odds ratio=1.01, 95% confidence interval=1.00–1.02). There was no statistical association with CMBs. In subgroup analysis according to the presence of hypertension, VOI was closely associated with WMH volume/lacunes only in patients without hypertension. In patients with hypertension, these statistical associations disappeared.
Conclusion
A high VOI was associated with cSVD in a neurologically healthy population, especially in patients without hypertension. This marker of arterial stiffness could be convenient and useful predictor of cSVD.
INTRODUCTION
Cerebral small vessel diseases (cSVDs) are subclinical pathologies mainly found in the elderly, and their prevalence is increasing worldwide with the development of brain imaging technology (e.g., magnetic resonance imaging [MRI]).1 Although asymptomatic on their own, cSVDs are clinically important because they increase the risk of stroke and dementia.2,3 cSVD contains several subtypes with different pathologies (e.g., white matter hyperintensity [WMH], lacunes, and cerebral microbleeds [CMBs]), which are usually found coexisting in images.4 Therefore, many studies have been conducted to find a common pathological mechanism to explain the occurrence of different cSVD subtypes. Several possible mechanisms and risk factors have been proposed, one of which is arterial stiffness.5,6
The medial wall of arteries contains rich elastic fibers.7 With aging or prolonged exposure to elevated blood pressure (BP), these elastic fibers are degraded, smooth muscle cells proliferate, and extracellular matrix accumulates, which is called vascular remodeling.6,7 Through this process, the arteries gradually stiff. The index reflecting this, arterial stiffness, has shown a close relationship with stroke or cSVD in previous studies.6,8-10 Vascular overload index (VOI) is an indicator that can be calculated using systolic and diastolic BP, and is a comprehensive parameter that reflects the following three circulatory abnormalities: 1) increased arteriolar resistance, 2) increased large-artery stiffness, and 3) early or premature reflection of arterial pulse wave.11 Therefore, physiologically, this indicator is expected to predict cardiovascular/cerebrovascular risk better than isolated systolic or diastolic BP. However, studies examining the association between VOI and cerebrovascular disease have not yet been properly conducted.12
Strokes, once they occur, often leave a disability because neurological recovery is limited. Therefore, if it is possible to reduce the risk by preventing the progression of cSVD before stroke occurs, it will be helpful in the quality of life of the patient. In this study, we evaluated the association between VOI and cSVD in a neurologically healthy population. In addition, by comparing the association with VOI for each subtype of cSVD, we also evaluated whether arterial stiffness is a common mechanism encompassing all the pathologies of cSVD or has a correlation only with a specific pathology.
SUBJECTS AND METHODS
1. Study population
From a registry at a large medical center in Korea (Seoul National University Hospital Heath Promotion Center), we included consecutive participants who conducted a voluntary routine health check-up, between 2006 and 2013. Among them, participants who satisfied the following conditions were excluded: 1) younger than 30 years of age, 2) having a stroke or other severe neurological deficits, 3) missing data on covariates, and 4) did not conduct brain MRI. Finally, a total of 3,231 participants were included in the final analysis.
2. Clinical assessments
We broadly evaluated demographic, clinical, and laboratory factors, including age, sex, body mass index, hypertension, diabetes, hyperlipidemia, ischemic heart disease, current smoking, systolic and diastolic BP, pulse pressure, and VOI.1 BP was measured on the left arm by using sphygmomanometer with a cuff of appropriate size after the participants has rested on a chair for at least 5 minutes, following the standard protocol.1 Using the systolic and diastolic BP measured in this way, the VOI value was calculated based on the following formula: VOI (mmHg)=1.33×systolic BP-0.33×-diastolic BP-133.3.11,12 Laboratory examinations were performed on the same day after 12 hours of overnight fasting, including hemoglobin A1c, fasting glucose level, total cholesterol level, white blood cell (WBC) counts, and high-sensitivity C-reactive protein (hs-CRP) level.1
3. Radiological assessments
In this study, all participants underwent brain MRI and magnetic resonance angiography (MRA) using 1.5-T MR scanners (Signa, GE Healthcare, Milwaukee, WI, or Magnetom SONATA, Siemens, Munich, Germany). The detailed MRI acquisitions were as follows: T1-weighted images [repetition time (TR)/echo time (TE)=500/11 ms], T2-weighted images (TR/TE=5,000/127 ms), T2 fluid-attenuated inversion recovery images (TR/TE=8,800/127 ms), T2-gradient echo images (TR/TE=57/20 ms), and three-dimensional time of flight MRA images (TR/TE=24/3.5 ms, slice thickness=1.2 mm). The slice thickness was 5 mm, except for time-of-flight MRA images.
As subtypes of cSVDs, we evaluated WMH, lacunes, and CMBs. WMH was quantitatively rated using Medical Imaging Processing, Analysis, and Visualization (MIPAV, version 7.3.0, National Institutes of Health, Bethesda, MD, USA) as in our previous studies.1,13 Using this program, we were able to measure WMH volumes semi-automatically from converted DICOM files. Lacunes were defined as asymptomatic 3–15 mm well-defined lesions in the territory of perforating arterioles, with signal characteristics same as those of the cerebrospinal fluid on T1- or T2- weighted images.4 CMBs were defined as a focal round lesion of <10 mm in size with low signal on T2-gradient echo images.4 CMBs were divided into lobar CMBs and deep CMBs according to the location of the lesions. Intracranial atherosclerosis (ICAS) and extracranial atherosclerosis (ECAS) were defined as an occlusion or more than 50% stenosis in intra- and extracranial vessels on flight MRA images.14,15 All radiological parameters were rated by two neurologists (K.-W.N. and H.-Y.J.), and disagreements were resolved by discussion with a third rater (H.-M.K.).
4. Statistical analysis
To compare the traits of patients according to the VOI level, we analyzed the baseline characteristics for each VOI tertile. The Kruskal-Wallis test and chi-squared test were used here. Univariate linear regression analyses were conducted to identify possible predictors for WMH volumes. Continuous variables with skewed data were transformed into a log scale. Only the WMH volume was calibrated on a square root scale because the data contained a large number of zero values. Variables with a result of p<0.10 in univariate analyses were introduced into the multivariable linear regression analysis along with age, sex, and VOI as confounders. Since lacunes and CMBs are variables classified as binary outcomes, we performed multivariable logistic regression analysis with the same logic. In the case of CMB, subgroup analyses of deep CMBs an lobar CMBs were also performed considering their different pathologies.
In addition, since VOI is a variable related to systolic and diastolic BP, we also performed subgroup analysis regarding the relationship between VOI and cSVD subtypes according to the presence or absence of hypertension. All variables with a p<0.05 were considered statistically significant in this study. All data and materials related to this article are included in the main text and in the supplemental materials.
RESULTS
A total of 3,231 participants were evaluated (mean age 57±9 years, male sex 53.9%). The mean WMH volume were 2.63±6.04 mL. The prevalence of lacunes and CMBs were 242 (7.5%) and 134 (4.1%), respectively. The mean VOI value was 9.27±17.98 mmHg. Other detailed baseline characteristics are presented in Table 1. When looking at the comparison between tertiles, the VOI level showed a correlation with age, male sex, body mass index, hypertension, diabetes, current smoking, systolic and diastolic BP, pulse pressure, hemoglobin A1c, fasting glucose level, total cholesterol level, WBC counts, WMH volume, lacunes, and ICAS (Table 2).

Baseline characteristics of the study population
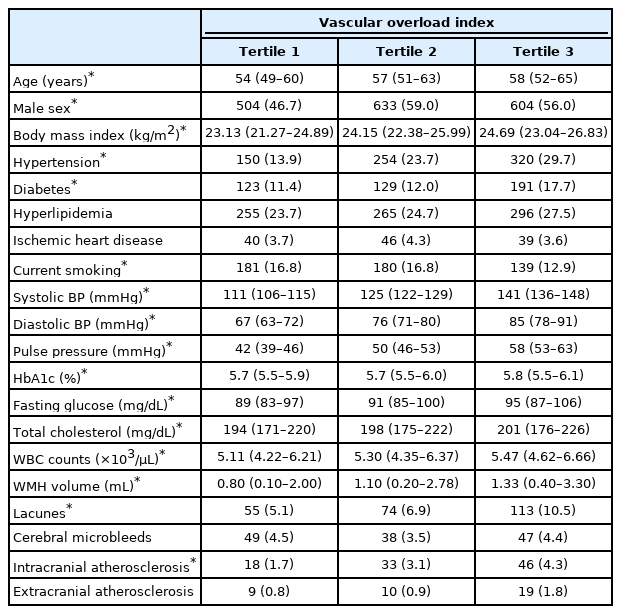
The differences of baseline characteristics according to the vascular overload index tertiles
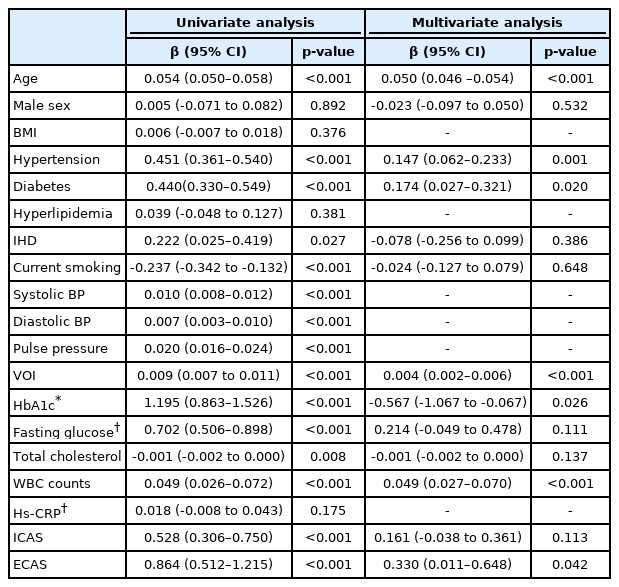
In univariate linear regression analysis, WMH volume were related to age, hypertension, diabetes, current smoking, systolic and diastolic BP, VOI, hemoglobin A1c, fasting glucose level, total cholesterol level, WBC counts, ICAS, and ECAS. In multivariable linear regression analysis, VOI was significantly associated with WMH volume after adjusting confounders (β=0.004, 95% confidence interval [CI]=0.002–0.006). Age (β=0.050, 95% CI=0.046–0.054), hypertension (β=0.147, 95% CI=0.062–0.233), diabetes (β=0.174, 95% CI=0.027–0.321), hemoglobin A1c (β=-0.567, 95% CI=-1.067 to -0.067), WBC counts (β=0.049, 95% CI=0.027–0.070), and ECAS (β=0.330, 95% CI=0.011–0.648) were also showed close correlation with WMH volume, being independent from VOI (Table 3).
In multivariable logistic regression analysis, VOI was closely associated with the presence of lacunes (adjusted odds ratio [aOR]=1.01, 95% CI=1.00–1.02) (Table 4). However, VOI did not show any statistical significance with CMBs (aOR=1.00, 95% CI=0.99–1.01) (Table 5). Even when subgroup analyses of CMBs were performed according to the location of the lesions, VOI showed only statistically marginal tendency with deep CMBs, but was not significant. There was no statistical tendency or significance between lobar CMBs and VOI (Table 6).
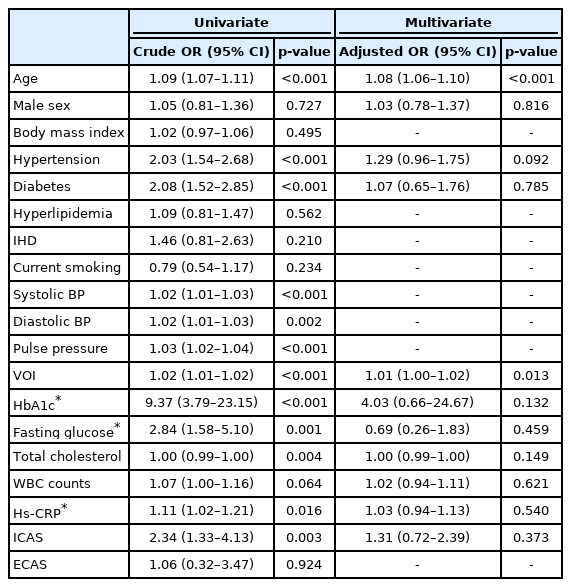
Univariate and multivariate logistic regression analyses between possible predictors and lacunes

Univariate and multivariate logistic regression analyses between possible predictors and cerebral microbleeds

Multivariable logistic regression analyses between possible predictors and lobar/deep cerebral microbleeds
This close relationships between VOI and WMH volume/lacunes were only found in participants without hypertension. In the presence of hypertension, there was no statistical significance between those factors. CMBs were not associated with VOI with or without hypertension (Table 7).

Multivariable linear and logistic regression analysis to evaluate association between vascular overload index and cerebral small vessel diseases according to the presence of hypertension
DISCUSSION
In this study, we found that high VOI was associated with cSVD in a neurologically healthy population. This close association was more pronounced in participants without hypertension. Therefore, our results can be interpreted as suggesting the possibility that VOI may predict the risk of developing cSVD in people not taking anti-hypertensives.
The exact pathophysiological mechanisms explaining the close association between VOI and cSVD are unclear. However, we could suggest several possible hypotheses. First, VOI is a parameter of arterial stiffness, which could be related to the main mechanisms of WMH and lacunes development. Arteries stiffened by aging and long-standing hypertension do not reduce pulse energy according to the Windkessel effect like normal arteries, but propagate it to the perforating arterioles.6 When cerebral autoregulation is damaged in this way, several pathological brain environments are created as follows: 1) endothelial dysfunction occurs, 2) the brain-blood barrier is disrupted and toxic substances infiltrate into the periventricular space, and 3) solute clearance through the glymphatic pathway is impaired.16-20 If these various mechanisms are affected over a long period of time, WMH or lacunes may develop as a result. Second, it can also be explained by the association between VOI and large-vessel atherosclerosis. As mentioned earlier, VOI is an index that reflects not only arteriolar stiffness or premature reflection of the arterial pulse wave, but also the stiffness of the large artery.11 This is actually evidenced by the close association between VOI and ICAS in our data (Table 2). The chronic diffuse hypoperfusion condition caused by ICAS can sufficiently contribute to the development of WMH and lacunes.21 Last, the association between VOI and cSVD may be a coincidence produced by sharing risk factors. Indeed, VOI showed statistically significant associations with several well-known cerebrovascular risk factors (Table 2).
Interestingly, VOI showed close relationships with WMH or lacunes, but not with CMBs. This is probably due to the heterogeneous nature of CMB pathologies.4 CMB is divided into deep and lobar CMBs, and deep CMB is considered to be a pathology related to hypertensive damage.4 However, lobar CMB is considered to be amyloid angiopathy and therefore has a close association with endothelial dysfunction or glymphatic clearance.22 Therefore, the mere fact that these two pathologies are mixed may explain why CMBs appear unrelated to VOI. Actually, when we separately analyzed deep CMBs and lobar CMBs, it was not statistically significant, but deep CMBs showed statistical tendency at VOI and p=0.090 level (Table 6). In addition, our study population was very young and there were many healthy people with rare cardiovascular risk factors. For this reason, the prevalence of CMB itself is low, which may lose statistical significance. It is necessary to verify this with another study population with a higher prevalence of CMBs.
As mentioned earlier, VOI showed associations with cSVDs only in those without a history of hypertension. This may be because patients with long-standing hypertension already have higher arterial stiffness and advanced cSVDs. In our data, participants with hypertension were older, had a higher VOI value, and a higher burden of cSVD than the rest. If arteriosclerosis and cSVD are already severely advanced due to aging and long-standing high pulse pressure, the influence of current BP may no longer be important. Another possibility is that a single value of VOI cannot serve as a good representative value in hypertensive patients. Patients with hypertension have varying BP depending on the type of anti-hypertensives, the time of taking it, and the dose. Therefore, a single value of VOI calculated using systolic and diastolic BP measured once may not properly represent the patient’s usual state. Nevertheless, VOI is a simple index that can be obtained using only a sphygmomanometer. We can easily measure our BP several times a day, every day. Using this easy accessibility, if the fluctuation- or average-value of VOI over a long period is obtained, it may be possible to more accurately predict the volume change of WMH or the additional occurrence of lacunes.
There are several limitations to interpret our results. First, this study is a retrospective cross-sectional study. Even if VOI is statistically close to WMH volume and lacunes, it only implies an association and does not guarantee a causal relationship. To prove this, further prospective studies are needed. Second, we used a single measure of VOI. BP is a value that changes depending on the measurement time, environment, and physical conditions. Therefore, it may have been possible to interpret the results more interestingly if the average or variation of the VOI values measured several times was used. Third, VOI is certainly a useful indicator, but it is not yet a widely used and familiar indicator. Therefore, it would have been more helpful for readers to understand if it included comparisons with well-known arterial stiffness indexes such as pulsatility index, pulse wave velocity, and augmentation index. Last, our study population is a relatively young and healthy population. Therefore, the influence of other major cardiovascular risk factors may be underestimated and the influence of VOI may be overestimated.
In conclusion, we identified that VOI was closely related to cSVD in a neurologically healthy population. Recently, the American Heart Association/American Stroke Association reclassified patients with BP previously classified as prehypertension as stage 1 hypertension to manage the risk of cerebrovascular and cardiovascular diseases at an early stage.1,23 That is, it is important to manage BP in patients at an early stage before they progress to severe hypertension. In this context, our findings can be interpreted as VOI is valuable as a predictor to evaluate the risk of early cerebrovascular disease in place of solitary systolic or diastolic BP. However, our results should first be validated by further studies.
Notes
Ethics statement
The study was approved by the Institutional Review Board (IRB) of the Seoul National University Hospital (IRB No. 1502-026-647). The requirement to obtain informed consent from participants was waived by the IRB due to the retrospective study design using de-identified information. All experiments were performed in accordance with the Declaration of Helsinki and relevant guidelines and regulations.
Availability of Data and Material
All data and materials related to this article are included in the main text.
Sources of Funding
None.
Conflicts of Interest
No potential conflicts of interest relevant to this article was reported.
Acknowledgements
None.