


INTRODUCTION
Stroke is a leading cause of death and chronic disability worldwide1,2 while at the same time mortality has decreased in high-income countries due to improvements in both primary prevention and acute management. Modern acute ischemic stroke (AIS) treatment is based on timely reperfusion of the ischemic brain parenchyma using two proven effective treatments, intravenous thrombolysis (IVT) with tissue plasminogen activator and mechanical thrombectomy (MT).3,4 Despite decades of evidence that it can reverse neurological deficits and improve clinical outcomes,5 IVT is only delivered to a small number of AIS patients worldwide.6 Until recently, only 7.3% of AIS patients in Europe7 and 3.6–6.5% of AIS patients in the United States were treated with IVT.8
The short therapeutic time window of 4.5 hours introduced by the approval randomized-controlled clinical trials (RCTs) was one of the major barriers in the effort to expand the administration of IVT. Similarly, initial RCTs and guidelines regarding mechanical thrombectomy4,9 established a time limit of 6 hours. This “need for speed” approach imposed significant obstacles on the delivery of reperfusion treatments, depriving a significant proportion of patients from potentially lifesaving interventions. In order to overcome time restrictions, a paradigm shift from “time is brain” to a more individualized precision medicine approach now called “imaging is brain”, was needed.10 The driving force behind this transition has been the development and evolution of advanced neuroimaging.
This shift in AIS approach is also prompted by the fact that no single, linear model accurately describes the temporal evolution of human cerebral ischemic injury. Many researchers suggest that the infarct growth curve may have an exponential or sigmoid growth trajectory, with more rapid progression at intermediate times after symptom onset than early times after symptom onset, but available human serial brain imaging studies have not confirmed this hypothesis.11 Several studies12,13 indicate that there is a high variability of neuronal loss in patients with large vessel occlusion (LVO) attributed AIS, ranging from less than 35,000 neurons per minute to more than 27 million neurons per minute. On the basis of this great heterogeneity of infarct growth progression, we may now categorize patients to fast, intermediate and slow progressors. The prevalence of slow progressors who may benefit from reperfusion therapies up to 24 hours after symptom onset, is estimated to be greater than 30% by many different trials.13 Although time is still a co-factor in most case scenarios, imaging-based tissue fate prediction and appropriate patient selection is now the key player in the process of AIS management.
STANDARD AIS IMAGING
For many years non-contrast brain CT scan (NCCT) has been the cornerstone of AIS imaging. Following National Institute of Neurological Disorders and Stroke (NINDS) trial for IVT in AIS, NCCT provided important advantages: fast acquisition, low radiation exposure, low cost, practically no contraindications and high specificity in ruling out an intracranial hemorrhage; essentially everything a clinician needs to timely administer rtPA. Despite the relatively low sensitivity of NCCT for diagnosing AIS,14 early ischemic changes within the first 3h of onset can be detected by experienced physicians in almost 75% of patients with AIS due to Middle Cerebral Artery (MCA) occlusion.15 This observation led to the development of a score called Alberta stroke programme early CT score (ASPECTS),15 which is a useful tool for systematic evaluation of CT scans during acute stroke. Despite the fact that ASPECTS has a number of shortcomings, including low to moderate inter-rater variability,16,17 it is still a popular scale that has been applied in pivotal RCTs.
After approval of MT combined with IVT as the indicated treatment in AIS patients due to LVO, NCCT followed by CT angiography have been the new minimum standard for imaging in a disabling stroke. Nowadays, the majority of emergency departments that accept and treat AIS patients follow a CTA-for-all strategy, which has been shown to increase the detection rates of LVOs and the use of MT by 25%.18 A hyperacute Magnetic Resonance Imaging (MRI) protocol has also been implemented by many academic institutions; it helps in ruling out stroke mimics and has a far higher diagnostic accuracy than CT.19 However, MRI has several practical challenges: longer scanning times, contraindications in cases of metallic implants or claustrophobic/agitated patients, limited availability.
Despite being beneficial in practice, none of these techniques can fully capture the pathophysiology of AIS. They can depict to some extent the structural consequences of AIS but they are unable to provide information on the real-time cerebral perfusion disturbances and thus inform individualized decisions. To fill this gap, Advanced Neuroimaging (AN) incorporates perfusion sequences in the AIS protocol (CT/CTA plus CT perfusion or MRI/MRA plus MR perfusion). Perfusion software generates cerebral hemodynamic maps from four-dimensional data (volume over time) that reflect the likelihood of infarction in the event of persisting occlusion.20
THE EVOLUTION OF ADVANCED NEUROIMAGING FROM A HISTORICAL PERSPECTIVE
AN is an attempt to translate the entire evolution of basic knowledge in relation to AIS into clinical and imaging information. The key concept in AIS pathophysiology is the division of the hypoperfused tissue into three operational compartments21: the core, which will inevitably die, the oligaemia, which will theoretically survive, and the ischemic penumbra, which may or may not survive. This concept was introduced by EEG studies during carotid clumping in patients undergoing carotid endarterectomy. Trojaborg and Boysen,22 and Sundt et al.23 demonstrated EEG slowing when mean cerebral blood flow (CBF) fell below 23 mL/100 g/min, and EEG flattening when CBF fell below 15 mL/100 g/min. The subsequent seminal studies of cortical evoked potentials in MCA occlusion models of focal ischemia in baboons by Astrup et al.24 confirmed the presence of two CBF thresholds: the lower threshold (corresponding to “core”) characterized by energy failure and ion pump failure leading to high extracellular potassium and neuron death, and the higher threshold (less severe ischemia corresponding to “penumbra”) characterized by electrical failure but sustained energy metabolism and low extracellular potassium25 with a potential for recovery. Additionally, this concept has a dynamic, time-dependent interplay26: for example, tissue with a CBF of approximately 15 mL/100 g/min would withstand an occlusion for approximately 3 hours, whereas tissue with a perfusion rate of less than 5 mL/100 g/min will suffer a permanent deficit even if the occlusion is resolved after 30 minutes.
These findings from various animal species needed to be confirmed in human brain research. Baron and colleagues27 first used positron emission tomography (PET) scan to conduct proof-of-concept studies. A series of PET acquisitions following inhalation and injection of molecules labeled with the 15O radioactive tracer was used to map cerebral blood flow (CBF) and O2 metabolism biomarkers such as the oxygen extraction fraction (OEF) and the cerebral metabolic rate of oxygen (CMRO2). The latter was used to distinguish an irreversible tissue damage using a well-established threshold of 1.4 mL/100g/min.28 Baron’s group discovered four PET patterns29: (1) an isolated increase in CBV, maintaining the CBF; (2) an increase in OEF in response to the reduction of CBF but with a preserved CMRO2 (which corresponds to the oligemia); (3) a significant increase in OEF in regions with reduced CBF as well as CMRO2 (which maintain tissue metabolism), corresponding to the penumbra which was also termed as “misery perfusion”; and (4) a very low CBF and CMRO2 with variable OEF (ischemic core). Additional remarkable findings included the fact that some patients had a putative penumbra even up to 16 hours after the symptom onset, while other patients had irreversible brain damage as early as 6 hours, demonstrating the extreme variability in the time course of metabolic deterioration in humans, as well as the correlation between peri-infarct penumbra survival and improved functional recovery. Subsequent PET studies revealed that penumbra may persist for up to 18 hours or even longer,30,31 suggesting that therapeutic interventions can be effective even at this late stage.
Of course, PET is a powerful tool and undoubtedly the best imaging modality for quantification of the penumbra and the ischemic core, but only from an academic and research standpoint. The critical question was the translation of proof-of-concept studies into RCTs with robust patient selection for reperfusion therapies. As Warrach eloquently argued in a Stroke Controversies Section of early 2000s’ “the better technique of measuring ischemic penumbra is the one that will lead to effective stroke therapies”.32
MULTIMODAL MRI IN AIS – SEMINAL CLINICAL STUDIES
In clinical settings, MRI has demonstrated its ability to accurately delineate regions at high risk of progression to infarction (core) as well as the ischemic penumbra.33 Diffusion-Weighted-Imaging MRI (DWI) detects the infarct core with high sensitivity and becomes abnormal within minutes of ischemia onset.34 Restricted DWI denotes cytotoxic edema and, in general, permanently injured tissue. However, reductions in Apparent Diffusion Coefficient maps have been observed to be reversible in cases of early reperfusion,35,36 even though the notion of diffusion lesions reversibility (DLR) is still controversial. In the largest dataset37 from Effects of alteplase beyond 3 hours after stroke in the Echoplanar Imaging Thrombolytic Evaluation Trial (EPITHET) & Diffusion Weighted Imaging Evaluation for Understanding Stroke Evolution Study (DEFUSE) studies addressing this issue, two types of DLR were observed: a temporary DLR followed by a return of abnormal signal within 24 hours, which in the majority of cases, did not lead on to true tissue salvage and a permanent DLR which was universally associated with early reperfusion and generally concerned small volumes of tissue in the deep white matter, unlikely to be clinically relevant. DLR is linked to a potentially salvageable state and subsequent reappearance of imaging abnormalities represents a secondary injury, rendering this phenomenon a tempting target for neuroprotection trials.38 Given these considerations, for many years DWI restriction was used as a clinically reliable surrogate of irreversible ischemic tissue injury and formed the reference standard for the derivation of thresholds for ischemic core on subsequent studies using CTP (CT Perfusion).
Soon after the approval and incorporation of IVT as the standard of care, there have been studies of serial multimodal MRIs before and after IVT administration that aimed to provide a view of the pathophysiological changes occurring in the acute ischemic brain by using perfusion MRI (PWI). Efficacy of IVT was documented by Mean Transit Time (MTT) improvement and this was associated with excellent neurological outcomes in comparison to DWI changes.39 Moreover, it was shown that acute PWI volumes at presentation were independently associated with stroke severity and with final infarct size whereas acute DWI volumes were not.40 Thus, PWI volumes showed more accurate prognostic value than diffusion volumes. There was a greater beneficial effect on reperfusion as determined by MTT improvement in the first few hours after IVT than there was on reversal of cytotoxic ischemic injury (as determined by DWI), and in fact DWI improvement lagged behind perfusion improvement. IVT also led to significant reductions in final infarct volumes in patients with PWI/DWI mismatch even beyond 3 hours.40 DEFUSE study41 was the first multicenter cohort study that systematically used AN and confirmed the beneficial effect of early reperfusion in patients with PWI/DWI mismatch (Target Mismatch) compared to patients with no mismatch or patients with a malignant profile (large DWI or PWI lesion of more than 100 mL), the latter having a higher risk of harm from reperfusion treatments. These observations founded the PWI/DWI imaging mismatch concept, defined penumbra as the holy grail of the reperfusion therapies and formed the theoretical background for subsequent RCTs.
FIRST RCTS USING ADVANCED NEUROIMAGING IN IVT FOR AIS
EPITHET42 was a phase II prospective, randomized, double-blinded, placebo-controlled, multinational clinical trial in patients with AIS who were imaged with serial multimodal MRIs. Patients were treated with intravenous alteplase or placebo 3–6 hours after stroke onset. However, EPITHET did not use a mismatch criterion to determine selection for treatment. Its primary hypothesis was that IVT would attenuate infarct growth in patients who had a PWI/DWI mismatch consistent with that of DEFUSE study. Though underpowered, EPITHET showed a non-significant infarct growth reduction associated with better neurological and functional outcomes in patients treated with IVT, and provided further evidence favoring expansion of IVT beyond 3h in certain patients based on imaging criteria. It is essential to note that both EPITHET and DEFUSE trials were the first to incorporate post-processing of imaging data that included correction of arterial input and thresholding.
Desmoteplase in AIS trial (DIAS) 243 was the first phase III trial to test the mismatch hypothesis in AIS by using a new thrombolytic agent, desmoteplase. It was based on the encouraging results of the dose escalating phase 2 studies DIAS44 and Dose Escalation of Desmoteplase for Acute Ischemic Stroke (DEDAS),45 which both showed good clinical efficacy and safety for the doses 90 and 125 μg/kg of desmoteplase (single bolus administration). Interestingly this was the first trial to incorporate CT perfusion as an alternative screening modality in patients with contraindications to MRI. Nevertheless, DIAS 2 failed to show a beneficial effect for either dose of desmoteplase administrated in the 3–9 hour time window after symptom onset. The disappointing findings of this trial have been largely attributed to limitations of the study design and to chance.46 In addition to questioning desmoteplase’s therapeutic potential, researchers criticized the use of CT perfusion for potentially introducing penumbral selection errors due to limited brain coverage. Of note though, the investigators of desmoteplase trials used the “eyeball” technique to determine mismatch in “real time”, without post-processing.
OPTIMIZATION OF PERFUSION PARAMETERS
A metanalysis47 combining the data from these first five trials that had used AN and mismatch inclusion criteria, demonstrated that delayed thrombolysis was associated with a non-statistically significant trend towards higher reperfusion rates and improved outcomes. These results were still insufficient to fully establish a change in clinical practice, so additional steps were required. Key issues48 were how to optimally identify and quantify the PWI abnormality, what was the optimal mismatch ratio cutoff and how to standardize the use of multiple different parameters including CBF, MTT, time to peak (TTP), and Tmax (time-to-maximum of the residue function) maps (Table 1).49-51 What should be the best method to measure the hypoperfused area? Could there be an automated quantitative method of thresholding perfusion maps that would provide results in a timely manner?
Dani et al.52 carried out a pivotal systematic review that pooled data from various studies published up to August 2009 and which had used both CTP and MRP (MR perfusion). This analysis highlighted the huge heterogeneity in different definitions of tissue at risk, in various perfusion thresholds and acquisition techniques, as well as the small sample sizes of the studies. The authors argued against using unvalidated perfusion imaging thresholds and emphasized the importance of researcher collaboration to standardize perfusion acquisition and techniques of analysis.
The first step towards this direction was the development and validation of an automated post-processing software. RAPID (iSchemaView, Menlo Park, CA, USA) was firstly introduced for MR perfusion and its efficacy to perform real-time, fully automated identification of diffusion-perfusion mismatch in AIS patients, was proven49 in a large number of research datasets and across a wide range of imaging parameters and variable data quality. In the DEFUSE trial patients, when RAPID was compared to human reader (experienced neuroradiologist) there was a high agreement in mismatch assessment (k=0.90, Cohen’s kappa). RAPID was also able to identify mismatch with 100% sensitivity and 91% specificity (false positive rate=9.1%, false negative rate=0%). This unprecedented internal validity of an automated software eliminated the need for an on-site neuroradiologist and provided significant potential for RCTs, allowing reliable comparison of treatment effects regardless of the infrastructure of each participating center.
Several studies that employed various techniques as references, were reviewed in order to precisely assess the critically hypoperfused tissue and distinguish penumbra from benign oligemia en route to optimizing thresholds. A receiver operating characteristic analysis yielded an area under the curve of 0.95 for the detection of PET-confirmed CBF <20 mL/100 mL/min with an optimal Tmax threshold of 5.5 seconds, demonstrating the best performance of this threshold when compared to other metrics in AIS patients who were studied with PET 65 minutes after MRP acquisition.50 Similarly, DEFUSE investigators examined four different Tmax thresholds (>2 sec, >4 sec, >6 sec, >8 sec).51 Follow-up MRI imaging one month post stroke was selected as the reference method for calculations of penumbral salvage and final infarct growth. Tmax >6 seconds threshold performed better in patients with favorable outcomes, in patients with reperfusion and among those with target mismatch, whereas in patients who were not reperfused, the Tmax >4 seconds threshold best predicted final infarct volume. These findings were also replicated by the pooled DEFUSE/EPITHET dataset analysis52 by using RAPID post-processing software.
Even though perfusion imaging was better studied with MRI, CTP was also widely incorporated in clinical practice and RCTs due to its higher availability, accessibility and speed in the emergency departments. CTP parameters and thresholds were validated in comparison to MRI. When assessed by concurrent diffusion imaging,53,54 relative cerebral blood flow (rCBF) outperformed other parameters, including cerebral blood volume (CBV) in predicting the infarct core. False positive areas of low rCBF due to leukoaraiosis and due to the physiological gradient between grey and white matter, were corrected by restriction of core to voxels with both low rCBF and delayed Time to Peak (TTP).55 Chronic infarcts, gliosis, and cerebrospinal fluid regions were also automatically detected and removed from the analysis by the use of a Hounsfield unit threshold.54 Several studies60-63 have been conducted to determine which CBF threshold is the most appropriate for CTP and concluded that thresholds of 30% to 38% were optimal. Finally, rCBF less than 30% was chosen as the best surrogate for ischemic core prediction for two reasons56: it predicted the final infarct volume with low median absolute error57 (median 9 mL) while at the same time it favored underestimation instead of overestimation of the final infarct volume produced by other thresholds. From a clinical standpoint the latter is preferable, as it assists in ensuring that an eligible patient is not denied potentially vital treatments such as mechanical thrombectomy, and deprived from the chance of regaining neurological function. On the other hand, several studies58,63 have shown that Tmax greater than 6 seconds is the optimal penumbra threshold for estimating penumbra volumes, not only for MRP but also for CTP. Delay Time of >3 seconds used by alternative deconvolution methods has also been a reliable threshold.52,63,58
Brain coverage remains a limitation of CTP and only whole brain coverage CTP can be considered equal to MRP. A coverage of 80 mm should be the minimal accepted in order to fully capture ischemic core, while 90 mm is warranted to reliably identify the complete extent of ischemic lesions (both penumbra and core) in the axial direction in patients with anterior circulation ischemia.63 These technical considerations should be kept in mind when implementing a new CTP protocol (Table 2).
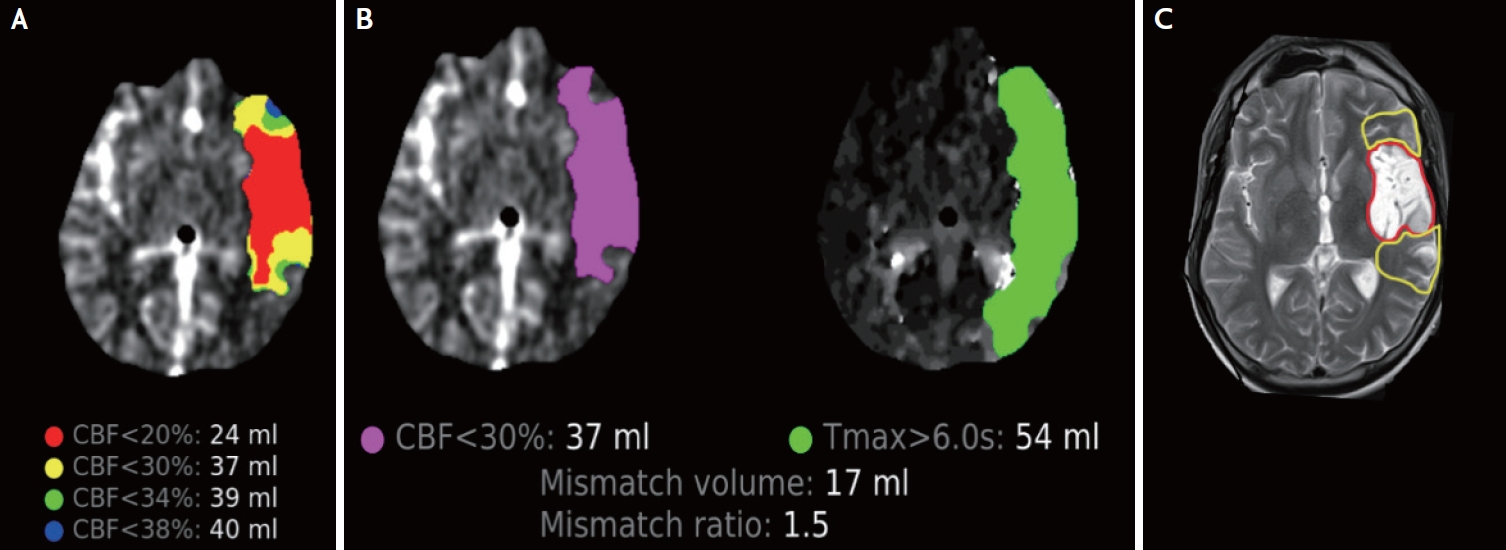
Another significant issue that was discovered early in CTP studies was the time dependence of ischemic core thresholds. An overestimation of irreversible ischemia by rCBF <30% threshold, known as “ghost core”, was observed in patients who were scanned in the very early window and who were timely reperfused by mechanical thrombectomy.59 This was reported even in AIS patients recanalized during up to 4.5 hours after stroke onset,60 whereas “ghost core” was more prominent when combined with a poor collateral status.61 However, in the largest prospectively collected dataset of Optimizing Patient’s Selection for Endovascular Treatment in Acute Ischemic Stroke (SELECT) trial,62 core overestimation was rather uncommon (6/101 patients; 5.9%) and observed only in patients scanned ≤90 minutes after stroke onset. Interestingly, “ghost” core disappeared by applying a more stringent CBF threshold of less than 20%. To the contrary, in the extended time windows the ischemic core may be underestimated on CTP when the recruitment of leptomeningeal collaterals has resulted in partial reperfusion of an already infarcted tissue,63 or the lesion has already become hypodense enough to fall below the automatic Hounsfield correction threshold. These observations do not call into question the validity of CTP as a technique, but rather emphasize the importance of adjusting the core thresholds over time and also underscore the need for a careful inspection and interpretation of the raw CT parenchymal images (Fig. 1).64
Finally, it should be noted that the terms ischemic core and ischemic infarct cannot be used interchangeably28 since core refers to imaging (CTP/MRP) or metabolism (PET) whereas infarct refers to histopathology. Additionally, when it comes to perfusion imaging, core thresholds are time dependent, whereas penumbra thresholds are not.
RCTS WITH ADVANCED NEUROIMAGING AND REPERFUSION THERAPIES – THE PARADIGM SHIFT
1. IVT
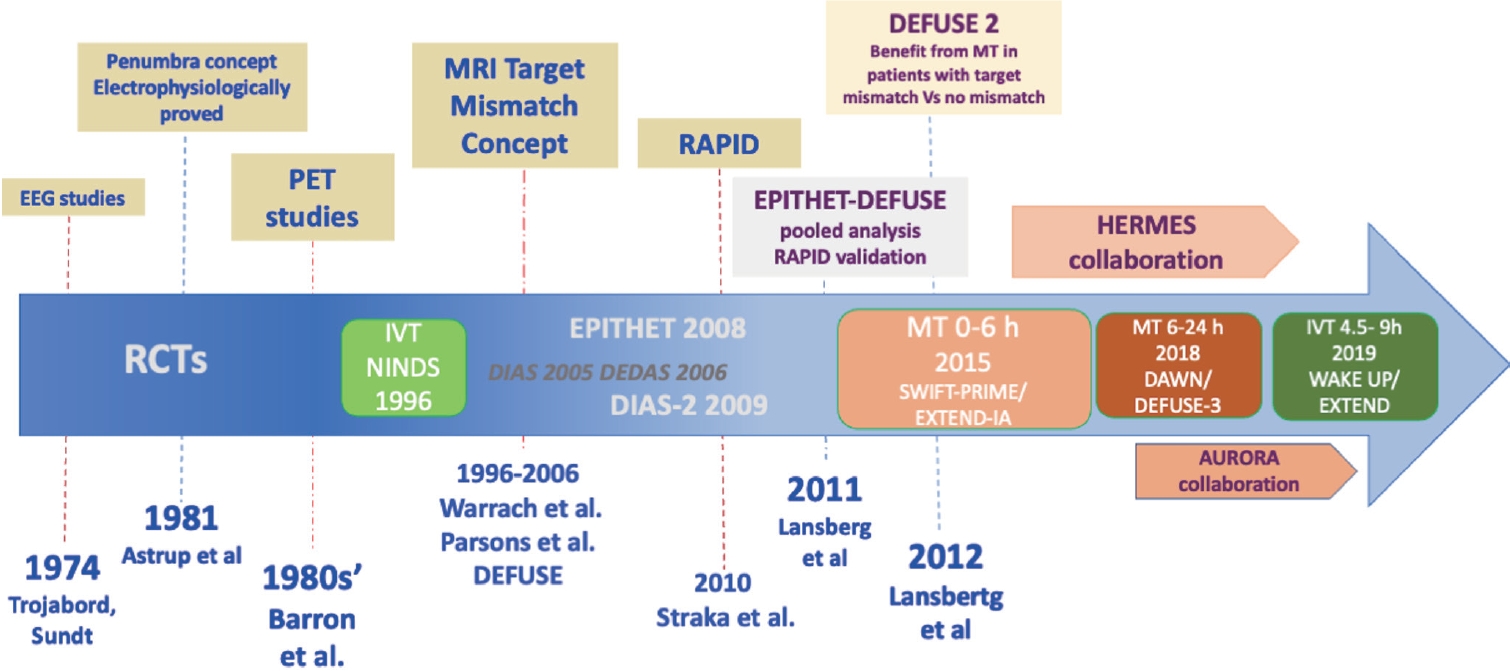
Evidence from RCTs is indispensable for changing everyday clinical practice. We had the first positive results after nearly two decades of research with negative clinical studies, which,however, contributed to the accumulation of knowledge and experience (Fig. 2). Extending the Time for Thrombolysis in Emergency Neurological Deficits (EXTEND) trial65 was the first phase III RCT that showed benefit of IVT for AIS beyond the time window of 4.5 hours (4.5–9 hours). Patients were screened with AN that used RAPID post-processing software and were deemed eligible to receive either standard doses of alteplase or placebo, if they presented certain imaging features: an ischemic core of less than 70 mL, a critically hypoperfused brain volume over 10ml and a mismatch ratio of 1.2. After enrolling two thirds of the final intended population the study was terminated. A significant improvement in the proportion of patients with favorable functional outcome (FFO; modified Rankin Scale [mRS] scores of 0–1 at 90 days) was observed in the alteplase group (adjusted risk ratio, 1.44; 95% confidence interval [CI]: 1.01–2.06; p=0.04), with the expense of higher rates of symptomatic intracranial hemorrhage (sICH), which nevertheless did not affect mortality rates at 3 months.
European Cooperative Acute Stroke Study 4—Extending the time for Thrombolysis in Emergency Neurological Deficits (ECASS4-ExTEND) trial66 was a trial with similar clinical eligibility criteria but slightly different neuroimaging criteria. MRP, which was processed with a different analysis protocol, had to demonstrate a PWI/DWI ratio of more than 1.2 and a PWI minimum volume of 20 mL. Large DWI lesions of over 100ml were excluded. The study was terminated due to recruitment futility, and demonstrated a non-significant trend towards better functional outcomes with IVT.
A different approach was studied in the WAKE-UP trial67 regarding AIS patients with symptoms discovered upon awakening. This was different from the physiological approach described earlier that targets mismatch using perfusion imaging, and rather represents a “tissue clock” approach using the DWI/FLAIR mismatch to identify patients with a high probability of symptom onset within 4.5 hours. Despite a non-statistically significant higher mortality rate, the WAKE-UP trial found that AIS patients treated with IVT had higher rates of 3-month FFO compared to placebo (53% vs. 42%).
The results of these trials were further enhanced by individual patient data68,69 and aggregate pairwise metanalyses,70 which suggested that AIS patients who are selected for treatment using AN techniques may benefit from IVT after 4.5 hours from symptom onset. Recommendations from international stroke organizations were modified accordingly.3,71 After the publication of these studies, many academic centers and stroke units worldwide began to publish their experience with off-label IVT administration72,73 and proposed further expanding the indications and time window with the use of AN.74
Efforts to overcome AN for IVT in the extended time window, have been proved fruitless until now. For instance, the TWIST trial75 administered tenecteplase or placebo in wake-up AIS patients bypassing the need for selection based on AN and used only NCCT. TWIST did not demonstrate any benefit with IVT compared to placebo and these results further supported the use of AN for the selection of AIS patients in the extended time window.76
2. MT in the 0–6 Hours Window
Only two of the major RCTs of MT that revolutionized AIS treatments used perfusion imaging and RAPID software as part of their eligibility criteria. Solitaire™ FR With the Intention For Thrombectomy as Primary Endovascular Treatment for Acute Ischemic Stroke (SWIFT PRIME)77 revised the initial imaging entry criteria after enrollment of the first 71 patients, in order to accommodate study sites with limited perfusion imaging capability and to ensure accelerated treatment delivery. Extending the Time for Thrombolysis in Emergency Neurological Deficits-Intra-Arterial (EXTEND-IA)78 persisted in stringent perfusion criteria until the end of randomization. Besides shorter times of onset to treatment and better angiographic revascularization rates compared to the other studies, EXTEND-IA demonstrated the highest absolute benefits from MT despite the small sample size. However, the imaging protocol was criticized for overselection of patients, as approximately 1 out of 4 clinically eligible patients were excluded on the basis of perfusion criteria.
An alternative paradigm was used in the Endovascular Treatment for Small Core and Anterior Circulation Proximal Occlusion with Emphasis on Minimizing CT to Recanalization Times (ESCAPE) trial79: the collateral selection based on multiphase CT angiography (mCTA). CTA was acquired in three different phases (arterial, mid venous and late venous)80 and patients with poor collateral status were excluded from randomization. Of note, 19% of patients (59 out of 315) were randomized between 5.5 hours (likely to have groin puncture after 6 hours from symptom onset) and 12 hours,81 paving the way towards an extension of the time window for endovascular therapy. Interestingly, there was no evidence of MT treatment effect heterogeneity before and after 5.5 hours from symptom onset (p=0.134, likelihood ratio test).
In ESCAPE trial CTP was optional and data from perfusion imaging were not required for randomization. A large proportion of the included patients (138 out of 316) finally received CTP, and among them the vast majority (91%) had a penumbral pattern.82 The low percentage of patients with absence of target mismatch (9%) could be explained by the fact that poor collaterals, which were an exclusion criterion in the ESCAPE trial, are most likely associated with non-penumbral patterns. This observation implies the significant overlap between CTP perfusion values and the different collateral grades (good, moderate, and poor tissue ‘perfusion’) as assessed with the qualitative method of ESCAPE trial.10 Indeed, there is still an ongoing debate regarding which method is the most effective for assessing collateral status. From a practical point of view, multiphase CTA is more challenging and may need more time to be interpreted than the time needed to both perform and process CTP, whereas single phase CTA, which is more readily available, is not reliable enough to appropriately grade collateral flow.83 Since CTA collateral grading relies on visual rather than automated assessment, its diagnostic accuracy may be also limited from the low interrater and intrarater agreement rates.8 In a study comparing CTP to mCTA,84 CTP-defined ischemic core volume estimation outperformed mCTA in predicting poor functional outcomes. Finally, the studies that used AN with perfusion imaging showed higher odds of good functional outcomes, a finding that was also supported by a metanalysis from our collaborative group,85 which demonstrated that AN selection markedly increased the probability of 3-month functional independence.
3. MT in the 6–24 Hours Window
The first trial to show the effectiveness of MT up to 24 hours after the symptom onset was the DWI or CTP Assessment with Clinical Mismatch in the Triage of Wake-Up and Late Presenting Strokes Undergoing Neurointervention with Trevo (DAWN) study.86 DAWN implemented a unique clinical-radiological dissociation strategy (Table 3), where DWI and CTP (rCBF <30%) post-processed with the RAPID software, were used to estimate infarct core, and NIH Stroke Scale as a surrogate of penumbra. The results were highly favorable to MT (3-month functional independence: 49% in the MT group versus 13% in the best medical management group), and they were comparable to the positive results of early time window MT trials.
Similarly, the Endovascular Therapy Following Imaging Evaluation for Ischemic Stroke (DEFUSE 3) trial87 randomized LVO patients 6–16 hours since last seen well. The trial was terminated early after the release of DAWN results. DEFUSE 3 implemented perfusion mismatch criteria (Table 3) and selected patients by either CTP or MRP and RAPID software. Important to notice is that CTP was used in 75% of randomized patients. Once again, there was a significant clinical benefit from MT (3-month functional independence: 45% in the EVT group versus 17% in best medical management group). Treatment benefit persisted for all examined subgroups including wake up AIS patients.
The AURORA (Analysis of Pooled Data From Randomized Studies of Thrombectomy More Than 6 Hours After Last Known Well) collaboration88 conducted a pooled individual data metanalysis from 505 patients across 6 clinical trials that further supported the results of DAWN and DEFUSE 3. The researchers demonstrated a benefit of MT as related to functional independence at 90 days, with rates in the thrombectomy arm being similar (45.9%) to that reported by the Highly Effective Reperfusion Evaluated in Multiple Endovascular Stroke Trials (HERMES) collaboration (46%)89 within the 0–6 hours window. The presence of a target mismatch on CTP predicted improved functional outcomes (odds ratio [OR]: 3.13; p=0.001), whereas a surprising finding was that this effect grew stronger over time, peaking between 12 and 24 hours (OR: 5.01; p<0.001). Patients with no target mismatch derived no clinical benefit.
These significant results of the “late window” trials were dubbed by many researchers as the “late window paradox”, and it was attributed primarily to an overselection induced by AN, that lead to recruitment of exclusively “slow progressors” with effective collaterals and large penumbra volumes. Based on the large treatment effects of the major “early window” trials (NNTs between 2 and 4), many argued that CT and CTA that were used at the early time window trials, would be also sufficient for treatment decisions within the 6–24 hours window overcoming the need for AN. However, initial post hoc data did not support this assumption. A metanalysis11 from the HERMES collaboration verified that MT was associated with improved outcomes when procedure start (groin puncture) was performed within the first 7.3 hours after stroke onset among patients with CT based imaging selection and diminished thereafter. Similarly, MR CLEAN reported loss of efficacy when onset to reperfusion time was longer than 6 hours.90
Recently MR CLEAN LATE,91 another “late window” trial which used a more pragmatic imaging criterion, presented its final results in the World Stroke Congress 2022. Notably, patients who met the DEFUSE 3 and DAWN criteria were excluded because they were treated in accordance with current guidelines. The presence of any collaterals in single phase CTA and the absence of clearly demarcated hypodensity on non-contrast CT in >1/3 of the middle cerebral artery territory were the only imaging prerequisites for inclusion. The study’s rationale was based on a previous post hoc analysis92 of MR CLEAN which demonstrated an interaction of collateral status with treatment efficacy, with higher collateral status linked to larger treatment effects but absence of any benefit in patients with no collaterals. The MR CLEAN-LATE trial reported that patients in the interventional group were approximately 1.7 times more likely than those in the control group to achieve better functional outcomes at 90 days (adjusted common odd ratio 1.67; 95% CI 1.20–2.32).93 Furthermore, data from observational cohort studies94,95 show that thrombectomy may benefit even more patients, with imaging characteristics beyond the strict DAWN and DEFUSE 3 criteria. While waiting the results of ongoing RCTs addressing the question of CT-based patient selection in the late time windows (NCT04256096), AN should be regarded as the only on-label imaging protocol with the higher level of evidence (class 1A) to guide reperfusion therapies in AIS patients with LVO presenting at the late-time windows.
Recently published RCTs that evaluated the potential benefit of MT in patients with large ischemic core on presentation who were a priori excluded from the initial MT trials, further called into question the neuroimaging criteria of low ASPECTS or/and large ischemic core. RESCUE LIMIT trial96 randomized patients with an ASPECTS score between 3 to 5 and demonstrated better functional outcomes in those treated with mechanical thrombectomy than best medical care (31% vs. 12.7% respectively in mRS 0–3 at 90 days; p=0.002). It is worth noting that this trial was conducted in an entirely Japanese cohort, in patients within the first 6 hours of symptoms or in patients with FLAIR-Diffusion mismatch as a surrogate for stroke onset within less than 6 hours, and the vast majority of patients (88%) were screened with MRI, which has far higher sensitivity than CT. ANGEL-LIMIT97 included patients with ASPECTS between 3 and 5 or ≤2 but with infarct core volume between 70 and 100 mL in CTP or DWI postprocessed with RAPID software. SELECT2 trial98 used an even more sophisticated imaging protocol in which large core should be proved based on either NCCT (ASPECT 3–5) or CTP with RAPID postprocessing (ischemic core volume ≥50 mL). Additionally, SELECT2 sought to ascertain whether or not patients with discordant imaging profiles (favorable CT/unfavorable perfusion imaging and unfavorable CT/favorable perfusion imaging) would respond to thrombectomy in different ways. Despite variations in design, imaging criteria, thrombolytic treatment/dose, and patient selection, all three trials produced very similar outcomes in favor of endovascular treatment. These results lead to further adjustment of the established criteria by extending the indications for MT to patients with ASPECTS 3–5 or ischemic core volumes of 50 mL and above,99,100 without reducing the value of AN.
PITFALLS OF INTERPRETATION-PRACTICAL CONSIDERATIONS
Nowadays, AN with MRI/MRP or CT/CTP is integrated into the standard acute imaging protocol for unselected AIS patients in several stroke centers. Our experience101 after more than 5 years from the incorporation of AN in the acute stroke chain pathway of unselected patients, showed that AN increased the yield of IVT administration without major effectiveness and safety repercussions and without provoking significant delays in the delivery of reperfusion therapies. It is important to emphasize that proper interpretation necessitates adequate training and experience, due to the technical and clinical diagnostic challenges of perfusion imaging.
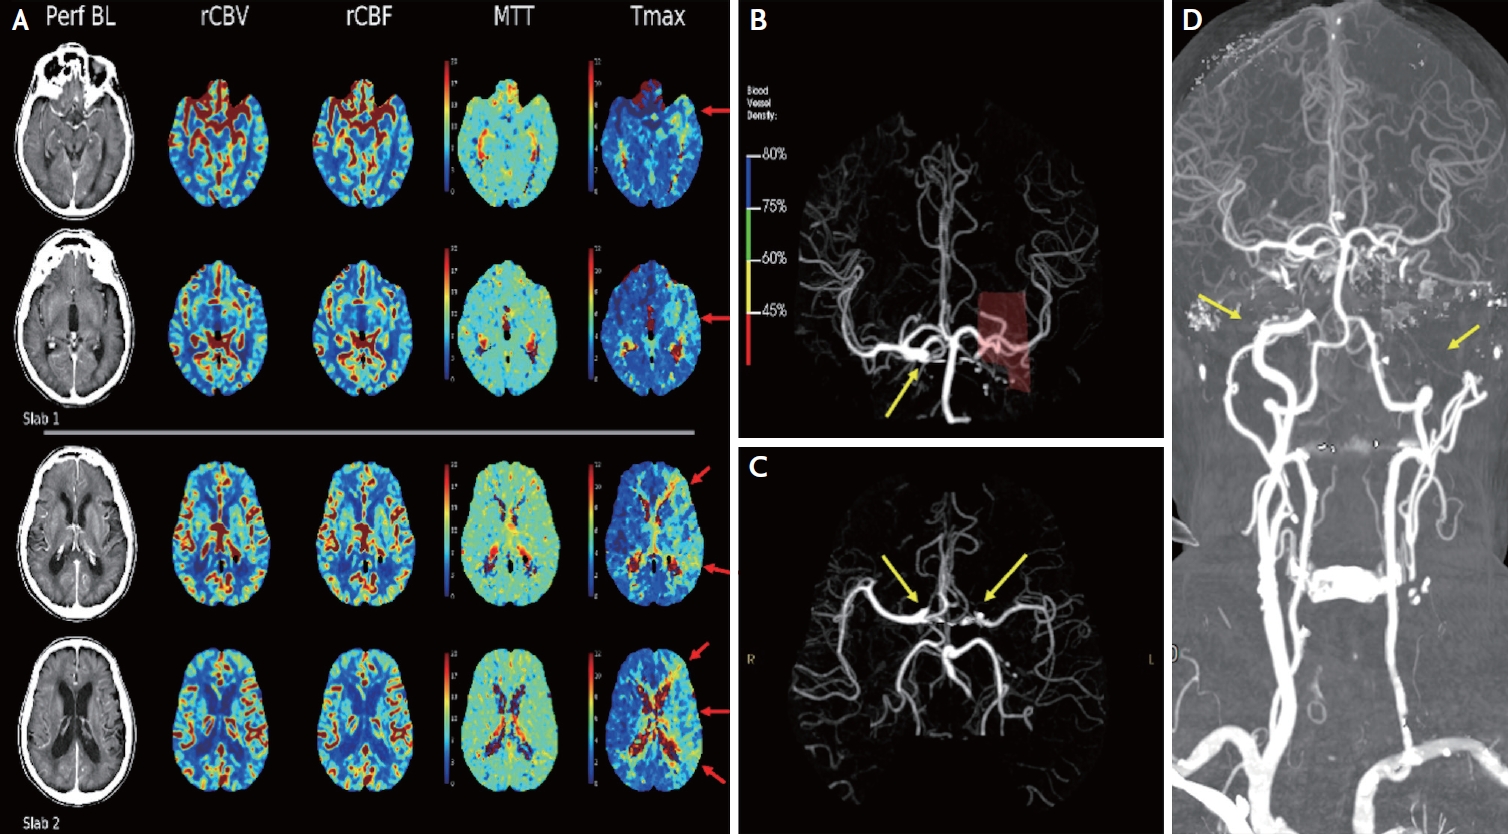
When trying to interpret a perfusion map,20,73 one must keep in mind the several limitations of the automated CTP imaging: the possible overestimation or underestimation of the ischemic core and penumbra volumes, as discussed in details earlier, the non-detection of minor perfusion deficits, the low specificity for lacunar lesions and the low accuracy regarding the estimation of mismatch, especially in posterior circulation infarction. Most of the clinical trials included patients with anterior circulation occlusion, thus the application value of perfusion imaging to AIS patients with posterior circulation remains to be discussed. Perfusion imaging is only a snapshot in time. CTP cannot fully depict the dynamic process of AIS and cannot provide information about what happened to the patient several hours before the scan. It is mostly a kind of poll that predicts whether neurons will die or recover. As a result, interpretation must always be done in the context of the specific clinical situation, the patient’s history, and a careful reading of the NCCT. For example, hypodense areas outside the perfusion lesion but in the same arterial territory may indicate partial reperfusion or clot migration, whereas such lesions in other territories combined with a history of recent neurological symptoms may indicate a subacute stroke, which is an absolute contraindication for IVT.73 Another common pitfall is Tmax delays that may be present in a patient with a chronic carotid occlusion despite normal CBF, CBV, and MTT because Tmax maps are sensitive to delayed contrast arrival (Fig. 3).102
Interpretation should always start by assessing image quality metrics before evaluating the color maps.72 Some important and frequent technical errors are due to patient motion, poor cardiac output, loss of intravenous access, truncation artifact/incomplete wash out, incorrect selection of Regions of Interest (ROIs). To obtain higher-quality images, radiologists and vascular neurologists should be trained to spot these issues and fix them manually when possible.
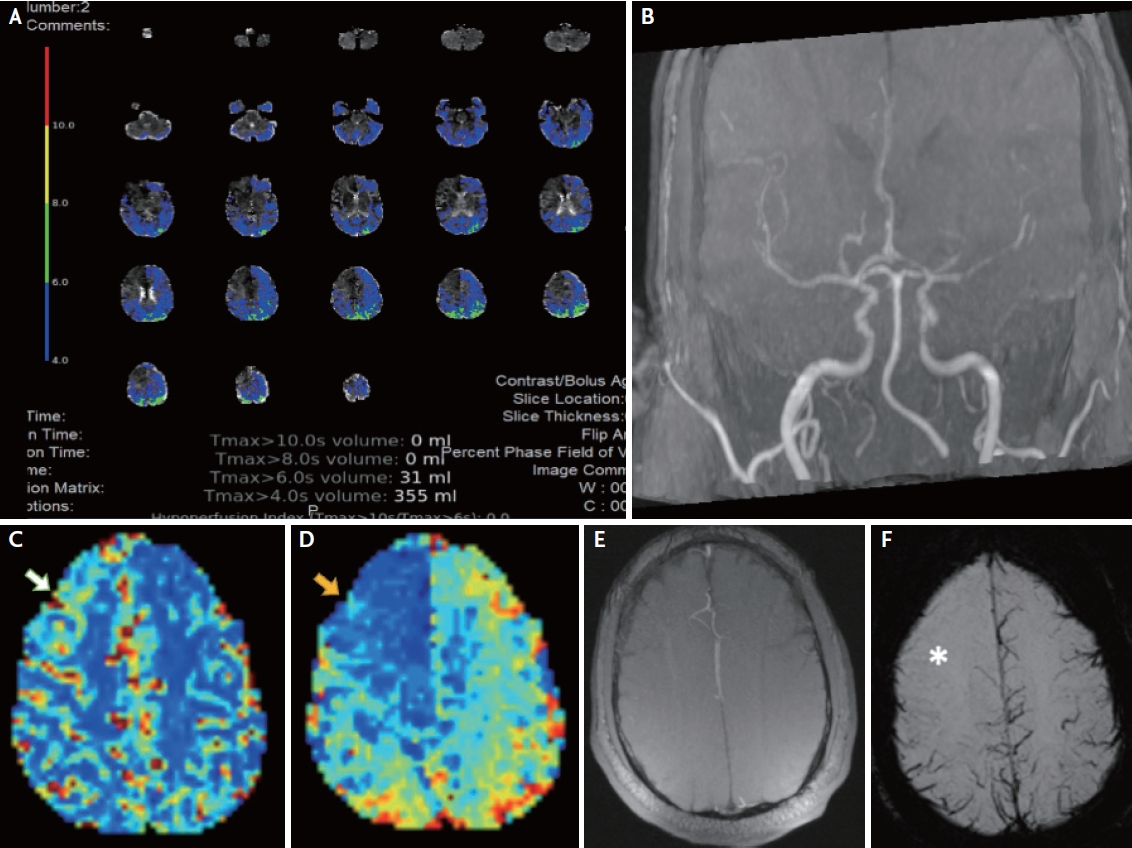
AN not only subsides critical clinical decisions concerning reperfusion therapies but, in the era of precision medicine and shared decision-making, may also assist in communicating decisions with patients and patient proxies by displaying colored maps and strengthen the diagnostic confidence. In addition, AN may help in excluding stroke mimics,103 in accelerating the therapeutic procedures in fast-progressors, and possibly in predicting prognosis. The diagnostic sensitivity of CTP in ruling out a non-ischemic lesion has been shown to be significantly higher than NCCT.104 A recent study using RAPID Tmax automated images demonstrated that the absence of perfusion abnormalities or the disclosure of findings that are completely inconsistent with clinical examination and vascular imaging should raise the possibility of a stroke mimic and thus prevent unnecessary IVT administration (Fig. 4).105
PERFUSION BIOMARKERS AND PROGNOSTIC SIGNIFICANCE
Apart from the initial/pre-treament ischemic core volume, which has been already highlighted by numerous RCTs and meta-analyses, a large number of clinical and neuroimaging biomarkers can be used to predict the clinical outcome of AIS patients after reperfusion treatments.106 Table 4 summarizes biomarkers used in several studies and their potential prognostic value. The most significant among them may indicate the degree of hypoperfusion and the pace of infarct growth, serving as surrogates of collateral status.
The hypoperfusion intensity ratio (HIR) is derived from Tmax maps and defined as the volumetric ratio of Tmax >10 seconds brain area within the Tmax >6 seconds brain tissue. Olivot et al.107 introduced HIR for the first time in 2014 and demonstrated in the DEFUSE dataset that it was a predictor of infarct progression. The median initial infarct growth velocity in the DEFUSE 2 was 3.2 mL/h (interquartile range [IQR], 1.2–8.4). The initial infarct growth velocity increased with HIR quartile. High HIR patients had faster initial infarct growth than low HIR patients: 7.2 mL/h (IQR, 2.9–17.8) versus 1.6 mL/h (IQR, 0.1–3.3; p<0.001). Consequently, HIR can distinguish between fast and slow progressors by quantifying the percentage of severely delayed arrival time. Following that, additional studies supported that HIR was a quantitative indicator of collateral status and could predict the rate of infarct growth and functional outcome. A favorable HIR (≤0.5) indicates good collaterals,108 patient eligibility for MT,109 lower extend of early oedema progression,110 first pass effect111 and a good outcome112 even in patients with a large ischemic core and a delayed recanalization time. Other studies113 showed that a HIR greater than 0.4 is a strong predictor of rapid inter-hospital infarct growth and can be used to guide triage decisions at primary stroke centers. Conversely, if HIR is less than 0.5114 someone may consider omitting re-imaging before proceeding to the angio-suite upon arrival to a comprehensive stroke center, provided that no clinical change has occurred during transfer. Other studies115 showed that HIR in addition to meticulous monitoring of blood pressure fluctuations during the first 24 hours, may play an important role in LVO patients, in terms of reducing final infarct volume.
Arenillas et al.116 introduced another similar perfusion biomarker, called mean rCBV (or CBV index) which was obtained by dividing the average of all CBV values from the Tmax >6 seconds region within the ischemic hemisphere by the average of all CBV values from all tissue areas with Tmax ≤4 seconds. CBV index predicted infarct growth in patients who had successful reperfusion as well as those who received endovascular treatment, regardless of baseline core volume or treatment arm, whereas in the same dataset HIR was not independently associated with infarct growth. The authors hypothesized that different aspects of collateral flow dynamics may be reflected by CBV index than HIR. Because HIR is based on arterial inflow delay within the ischemic brain tissue, it may primarily evaluate the arterial phase of collateral flow. rCBV, on the other hand, may also reflect venous outflow capacity, which is consistent with the higher predictive value of angiographic collateral scores that incorporate both arterial and venous information.117,118 These two indices are not a priori competitive but to the contrary CBV index and HIR can be combined to more accurately determine the collateral status (Table 5). In a post hoc analysis of the DEFUSE 3,119 non-reperfused AIS patients who presented unfavorable collateral assessments on both the CBV and the HIR, experienced the largest infarct growth at 24 hours, and only 4% of these patients experienced a favorable functional outcome rate at 3 months.
Early infarct growth rate (EIGR) was proposed by researchers of the SELECT trial.120 EIGR was defined as the ratio of the initial infarct size, based on ischemic core volume on perfusion imaging (defined as relative cerebral blood flow [<30%] volume), to time from stroke onset to imaging acquisition. EIGR was also independently associated with functional outcome, too. EIGR goes beyond the assessment of blood flow status in a certain time point, and illustrates stroke evolution in time, discriminating slow from fast progressors with an optimal cutoff of 10 mL/h. In another analysis,121 patients with fast ischemic core growth rates (>15 mL/hour) were more likely to benefit from bridging with IVT and achieve reperfusion earlier, than patients treated with direct MT.
Besides predicting response, AN may also identify patients at risk of early neurological deterioration (END)122 or patients for whom reperfusion may be detrimental in terms of hemorrhagic transformation (HT). Volumes of very low cerebral blood volume (VLCBV) and Tmax >14 seconds are shown to be the most reliable predictors of HT before reperfusion therapy.123 VLCBV was defined as CBV <2.5th percentile of normal brain in the contralateral hemisphere, with a threshold of >2 mL of VLCBV exhibiting excellent sensitivity in predicting parenchymal hemorrhage.124
CONCLUSIONS-NEXT STEPS
A recent cross-sectional retrospective study from the United States125 uncovered that the percentage of hospitals performing CTP was relatively low (14% in 2017) and were increasing at a slow rate (1.8%/year). Nonetheless, access to advanced imaging for acute stroke patients should be prioritized due to the significant clinical benefit demonstrated by all the studies and trials presented in this manuscript. Lessons learned from trials such as TWIST126 show us that failing to use available evidence on stroke imaging is clinically unjustifiable and wastes scarce health-care resources.
AN is the fruit of many decades of scientific research and efforts, and it is here to stay. A recent cohort study127 lends further support to the penumbra/core concept, demonstrating in a large dataset of 940 patients that each millimeter of penumbra that disappears is replaced by 1ml of ischemic core. Nevertheless, there are still numerous unanswered questions38 for future AN research to address:
• What is the role of AN in the early time window? Recently, PRACTISE (Penumbra and Recanalization Acute CT in Ischemic Stroke Evaluation) trial reported that patients imaged with CTP were less likely to receive IVT but had similar functional outcomes.128 Could AN help in recognizing patients who will achieve a good recovery regardless of the use of IVT?
• With the use of Big Data analytics and prognosis based on Machine Learning and Neural Networks, could we define the best predictive models based on perfusion imaging?
• In recent years, the prediction model using artificial intelligent (AI) or deep learning (DL) systems have been actively studied in acute stroke management.129 However, there are still a lot of steps that need to be completed in order to optimize the usage of AI in acute stroke130: more accessible large scale data repositories that will aid the testing of accuracy of AI models, guidelines and standards for reporting of ML models, testing and validation protocols, attuned algorithmic development that move beyond classifiers to address overfiting of software to particular datasets etc.
• In many studies, single thresholds overestimate the lesion volume in white matter while underestimate it in gray matter. Could we further optimize the thresholds for grey and white matter?
• Moreover, could automated maps be more interactive and take into consideration the time elapsed to provide more accurate core thresholds?
• How AN could be used in mobile stroke units and infield IVT?
• What is the role of AN in neuroprotection agents’ trials?
• RAPID’s extensive validation in numerous trials has lent support to its widespread use for patient evaluation; however, RAPID can be expensive, particularly in resource-constrained settings. Its scarcity necessitates the development of alternative platforms, techniques, or even better open-source software capable of producing perfusion maps that reliably assess perfusion parameters.
In conclusion, we believe that rather than “taking two steps forward and one step back” by attempting to use NCCT to expand the treatment windows for IVT and MT, we should try to further optimize AN, identify potential new fields of application, and generalize its use. International collaborations (such as STAIR consortium38) must be continued, as well as common databases that could enhance and support big data analytics.